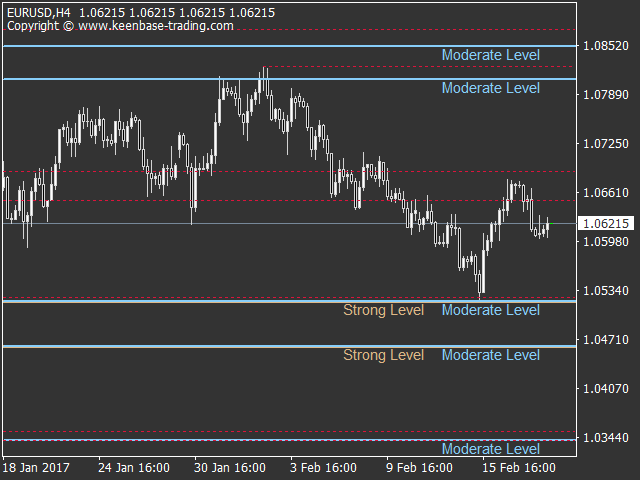
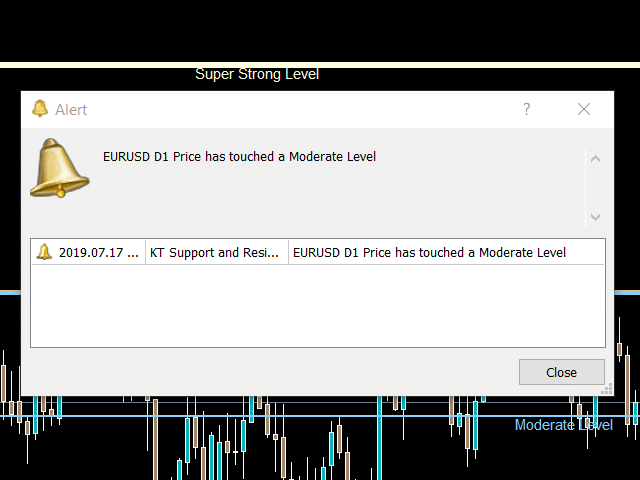
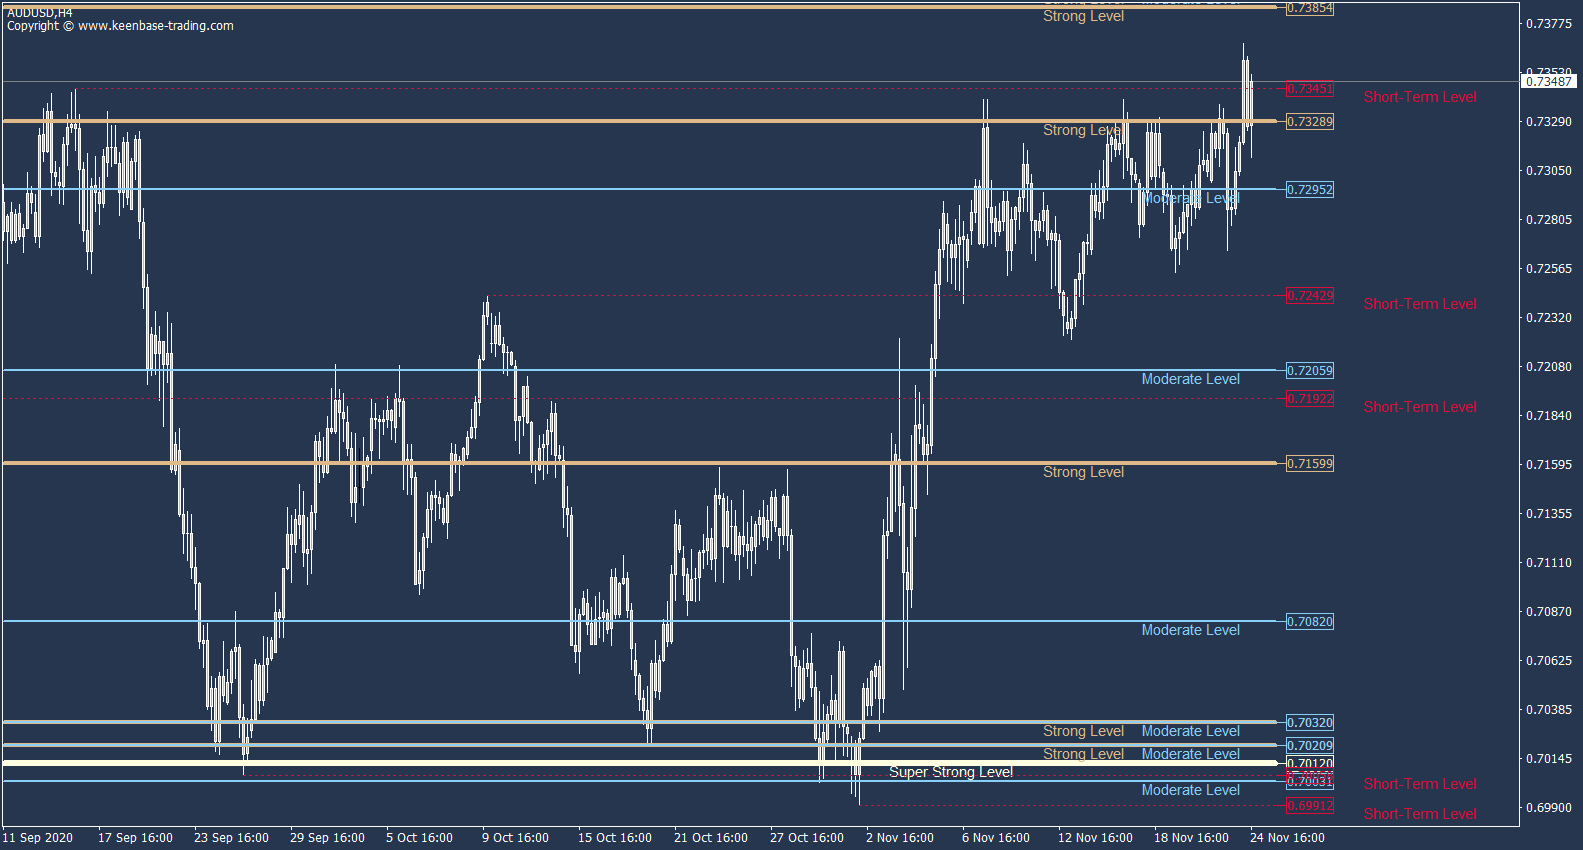
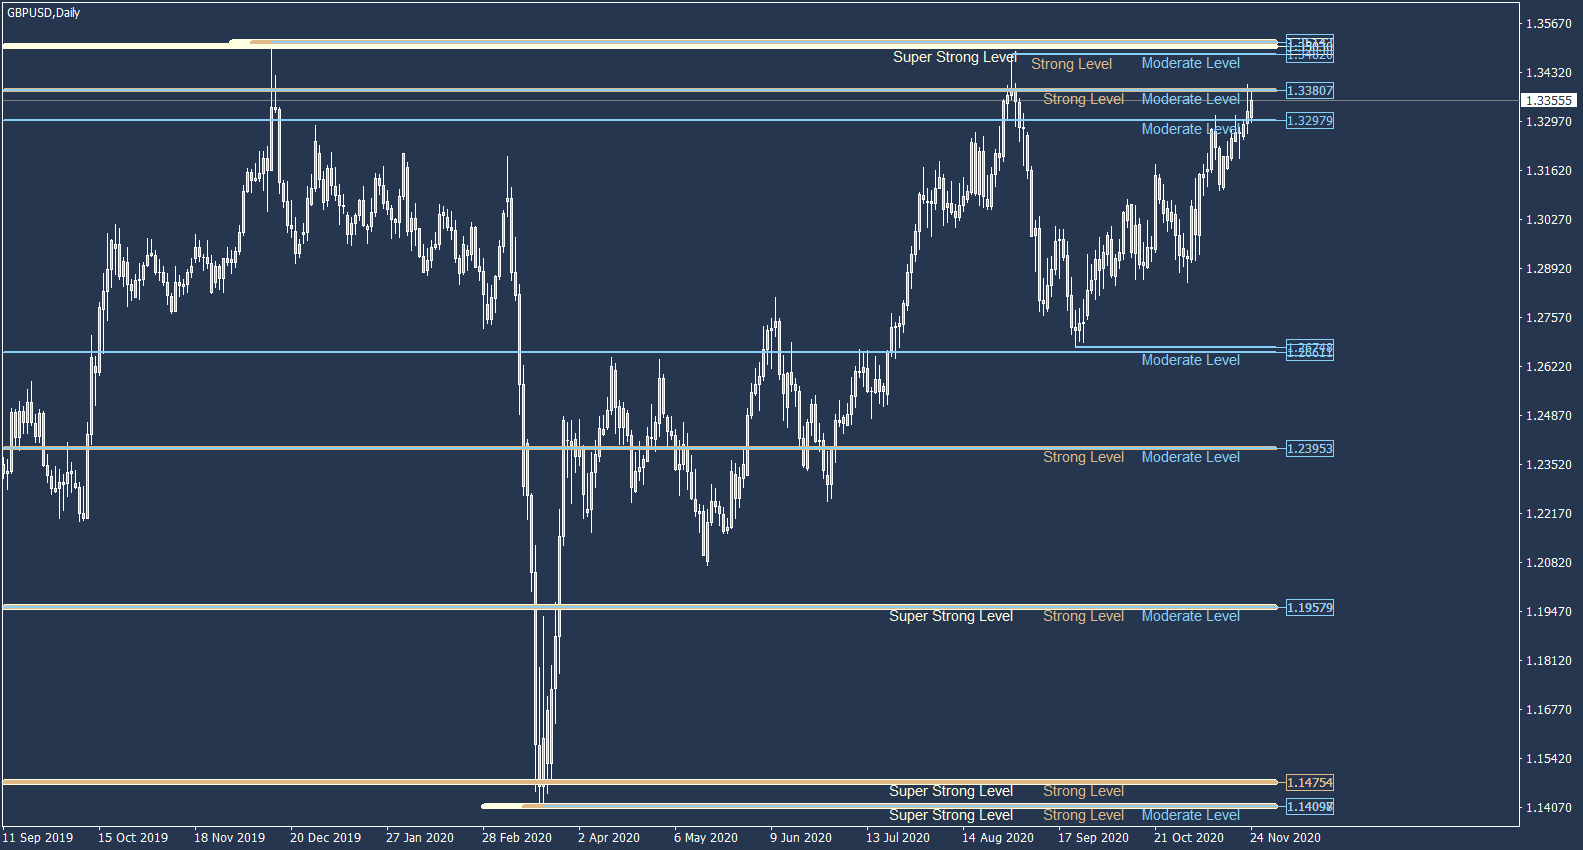
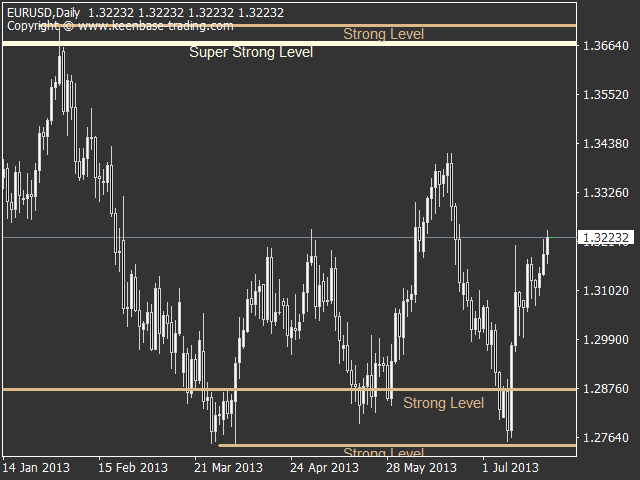
It quickly scans the most important extreme price zones across all time-frames and saves them in a stack when applied to the chart. A special algorithm then populates and iterates the stored extreme points for final selection.
It Plots Four Types of Support & Resistance Levels
1. Super Strong Support/Resistance Levels
These levels are the most substantial levels of all. Price will likely respect Super Strong Levels and often bounce back after testing them.
2. Strong Support/Resistance Levels
These are also substantial levels, and the price often respects them but not as much as their predecessor. However, if the price breaks them with a significant margin, you can expect a continuation in the same direction.
3. Moderate Support/Resistance Levels
If you are a day trader, you should keep an eye on these levels. Immediate trade entries around these levels should be avoided to prevent unnecessary losses.
4. Short-Term Support/Resistance Levels
These are comparatively weaker levels plotted using a precise time frame analysis. If you are a day trader or scalper, you may use these levels to decide on a stop loss and profit target.
Applications
- Filter out bad trades by avoiding trade entries around a significant support or resistance level.
- Automatically draw support and resistance levels using an advanced methodology and saves a ton of time every day.
- Prevent stop hunting by institutional traders by placing the stop loss before or after a support/resistance level.
- It includes a multi-timeframe approach in your technical analysis without switching to a different time frame.
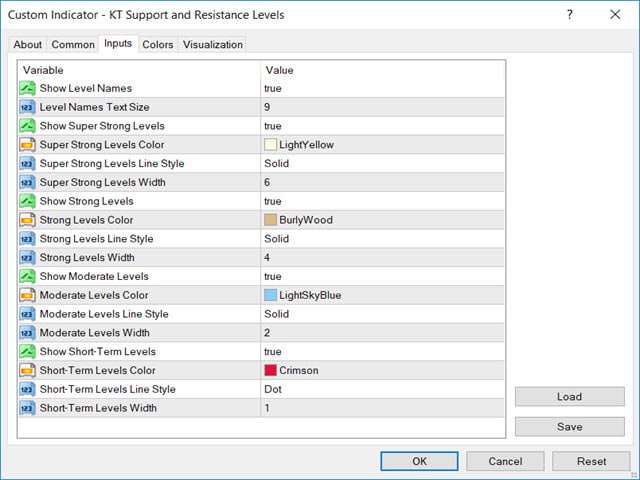
Input Parameters
Understanding the Support Level
The level of support is an area of high demand, which prevents the price from falling further. However, the price usually rises from the support level due to higher demand than supply.
A support price level or zone is where the buyers tend to hold power by triggering long positions.
Emotions and psychology also cause support levels to hold. And since countless participants are going through the same thought process, these levels are essential to incorporate into technical analysis.
Understanding the Resistance Level
Resistance is the price level or area where supply surpasses the demand, and consequently, the price fall from the resistance area.
It can also be defined as where sellers tend to become powerful by shorting the instrument in large amounts.
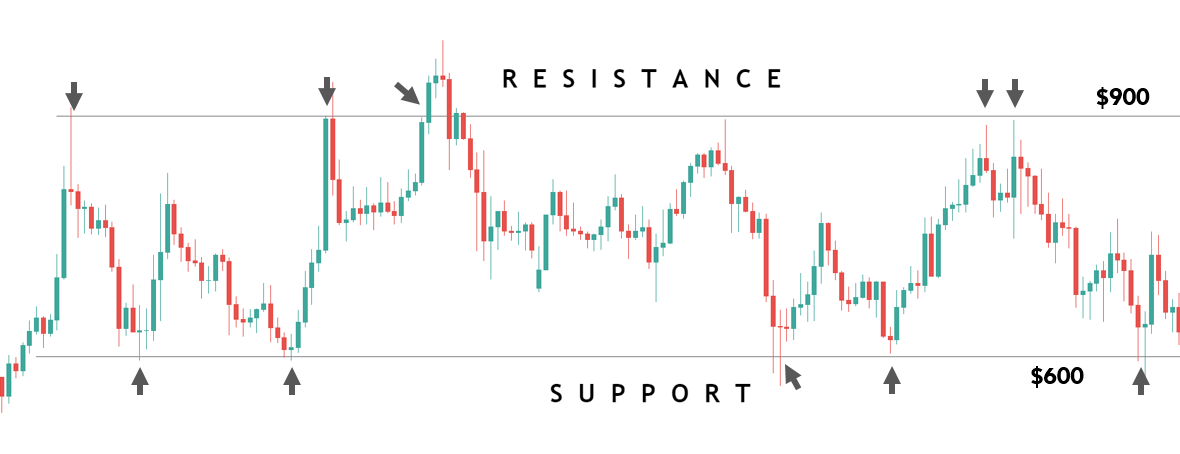
For instance, If an instrument goes from $600 to $900, then the price falls to $600 and again goes to the price of $900. The same cycle continues several times. It usually happens when an instrument's price is stuck between support and resistance levels.
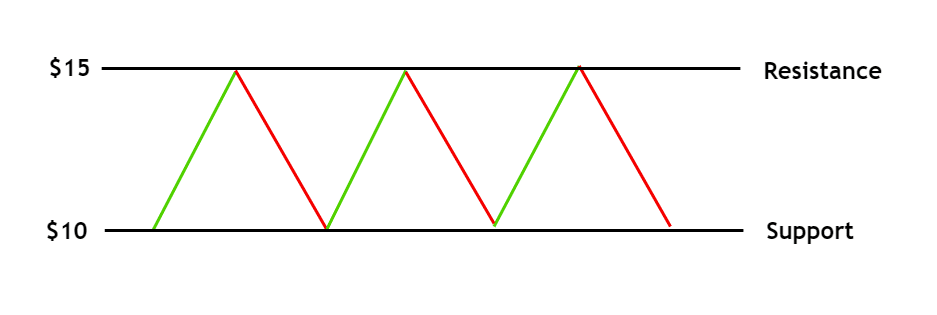
- A group of buyers goes long at $10, and the price head to $15, and then they close their positions at $15.
- New market participants are not willing to pay $15 for the asset, and would only do so if the price dropped to $10. This creates a potential resistance level of $10.
- If the price dropped by 5 USD, then buyers went long again. It creates demand for the instrument at $10, making it a potential support level.
Types of Support and Resistance used in Forex Trading
- Horizontal lines connect the significant swing highs and lows (This indicator uses the same methodology).
- Fibonacci retracement levels are either drawn manually or automatically.
- Trend lines and price channels also provide S/R levels. Strong price action usually occurs around such levels.
- Sometimes 200 moving average or 100 moving average is also used as a potential support/resistance zones.
To get a deep insight into the usage of Auto Support and Resistance indicator MT5, read our blog post - Support and Resistance Trading Strategies.
Pro Tip
You can also buy this auto support resistance indicator from MQL5 and MQ4 market.
