We hope you enjoy reading this blog post.
Become a Pro Trader by using our fine-tuned Indicators and Expert Advisors.
Support and Resistance Trading Strategies You Must Know in 2023
In technical analysis, there are several types of traders. Some trade using indicators, some by applying price action concepts, while the majority trade by spotting some chart patterns.
But all these technical traders have one trading concept in common – the concept of Support and Resistance.
Support and Resistance is a fundamental concept extensively used by technical analysts. In fact, it is also comprehended by fundamental analysts for precise entry and exit of trades.
With its importance in mind, let’s get our feet wet by understanding the S/R concept, how to draw them correctly, and some effective support and resistance trading strategies as well.
What exactly are Support and Resistance?
Support and Resistance are price levels in the market where the price could turnaround in the opposite direction based on supply and demand forces. They go hand in hand with the psychology of buyers and sellers.
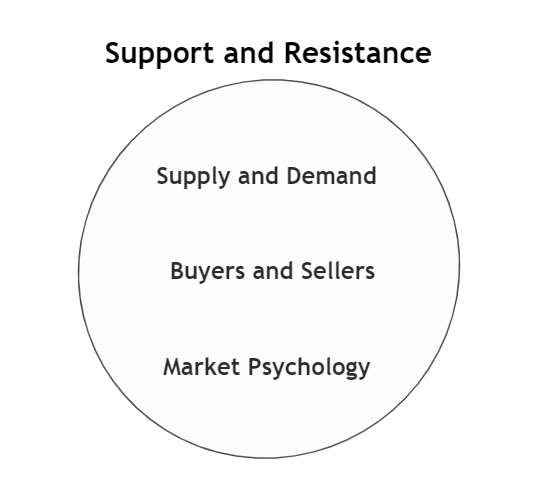
Understanding the Support Level
Support is a price level or area where there is a high demand for security, which prevents it from falling further. Due to higher demand than supply, the price rises from the support level.
In terms of buyers and sellers, Support can be termed as an area where the buyers tend to hold power by triggering long positions.
Emotions and psychology also cause support levels to hold. And since countless participants are going through the same thought process, these levels are essential to incorporate in technical analysis.
Understanding the Resistance Level
Resistance is the price level or area in the market where supply surpasses the demand for security. Consequently, the prices fall from that specific price level.
It can also be defined as where the sellers tend to become powerful by selling their securities in large amounts.
For instance, let’s say security rallies from $600 to $900. From $900, the price falls to $600 and again rallies to the same $900. The same cycle continues several times.
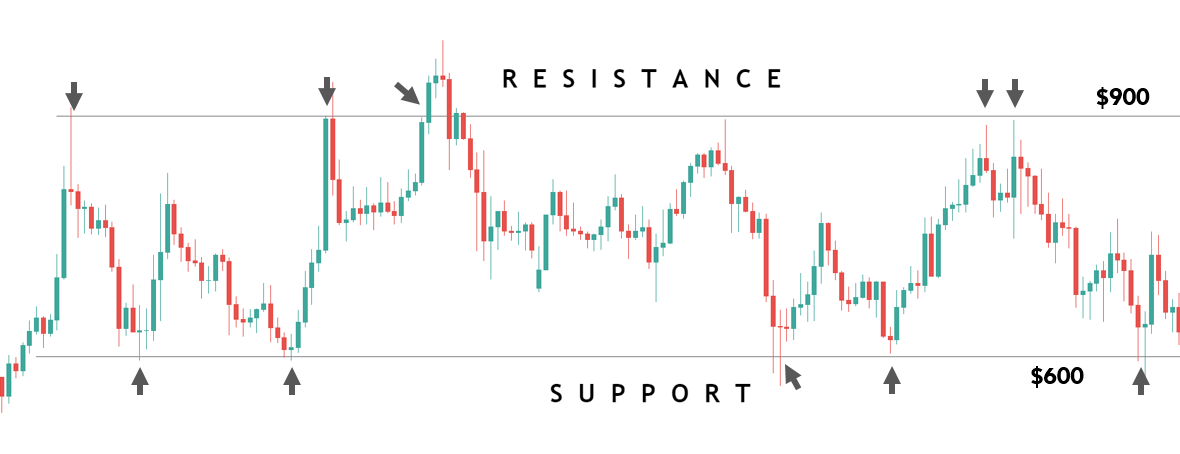
$600 is the price where buyers are desperate for long, while $900 is the price where sellers are actively willing to short the security. Thus, $600 becomes the support level and $900 as the resistance level.
The Psychology behind Support and Resistance
We must comprehend the psychology behind these levels before going into support and resistance trading strategies.
- In the below chart, there is a support level at $10.
- A group of buyers goes long at this price, and the prices head to $15.
- They take profits at this price by closing their positions.
- However, they do not buy at $15, as they find it to be expensive.
- They decide to buy again only if the price drops to $10.
- The price does drop by 5 USD, and the buyers buy again, more than the previous time.
- This creates demand in the security at $10, making it potential Support.
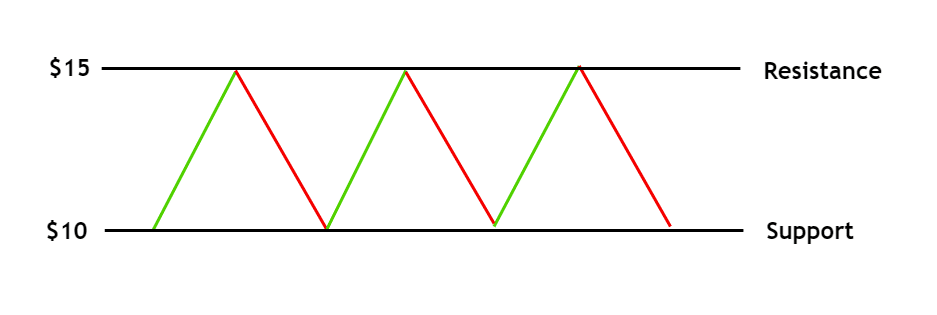
- There is another set of buyers who bought the security at $7.
- They square it off at $10. Then see it rally to $15.
- This group, too, find $15 to be expensive and wait for the price to retrace to their previous buy point.
- But the market drops to $10 and shoots to $15.
- They then realize that the ultimate Support is at $10. Thus, they prepare to trigger the buy trades when the security comes down to $10.
- As a result, more demand is created at $10.
- Let’s say both the above group of participants bought the security at $10, and do not close when it reaches $15.
- The market then drops to $10.
- The participants realize that the market has been dropping from $15, so they must close it.
- Hence, a potential resistance is created at $15.
How to Find Legitimate Support and Resistance Levels
There are countless Support and Resistance levels that can be spotted in every single chart. However, not all of them are significant.
In other words, there are some levels where the market fails to hold and breaks through it. Hence, merely understanding the definition of Support and Resistance is insufficient to trade in the market.
Identifying legitimate Support and Resistance comes from understanding the strength of the buyers and sellers. Many traders have a misconception that the power of Support and Resistance is proportional to the number of times it holds.
In reality, the potency of the buyers and sellers determines the legitimacy of buyers and sellers.
Will the Support and Resistance Hold or Not? Answering this question is the key while we trade the market using different support and resistance trading strategies. To answer this, two critical points must be considered – Strength & Length.
Strength
The power of buyers or sellers from the Support and Resistance areas determines whether a level is real. By 'power,' we mean how quickly the price reacted from the level.
If there is massive strength from the buyer at Support or the seller at Resistance, it indicates that these levels are strong, real, and likely to sustain.
Length
In addition to both parties' strength, the distance traveled from the Support and Resistance plays a vital role in determining legitimate levels.
If the market bounces off from a support or Resistance with significant length, that level can be considered real, and possibly respect the next time.
How to Draw Real Support and Resistance Levels?
Real Support and Resistance levels are those that satisfy the criteria of both strength and length. Let us take a few examples to understand the same.
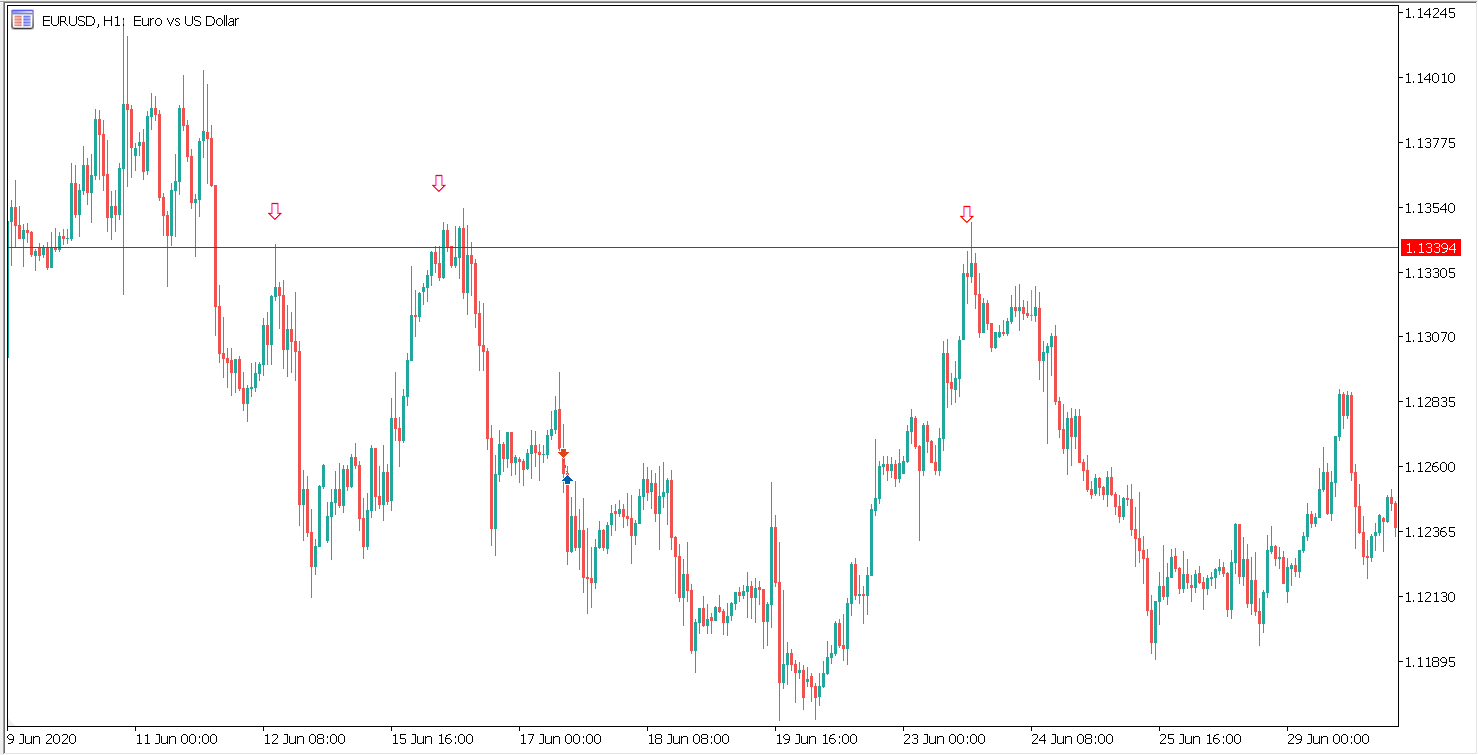
Below is the price chart of EUR/USD on the 1H time frame. Focusing on the two down arrows, both times, the price dropped sharply and the market longer in the second stretch. Thus, one can draw the line at this price (1.13394) and confirm that it is a potential Resistance.
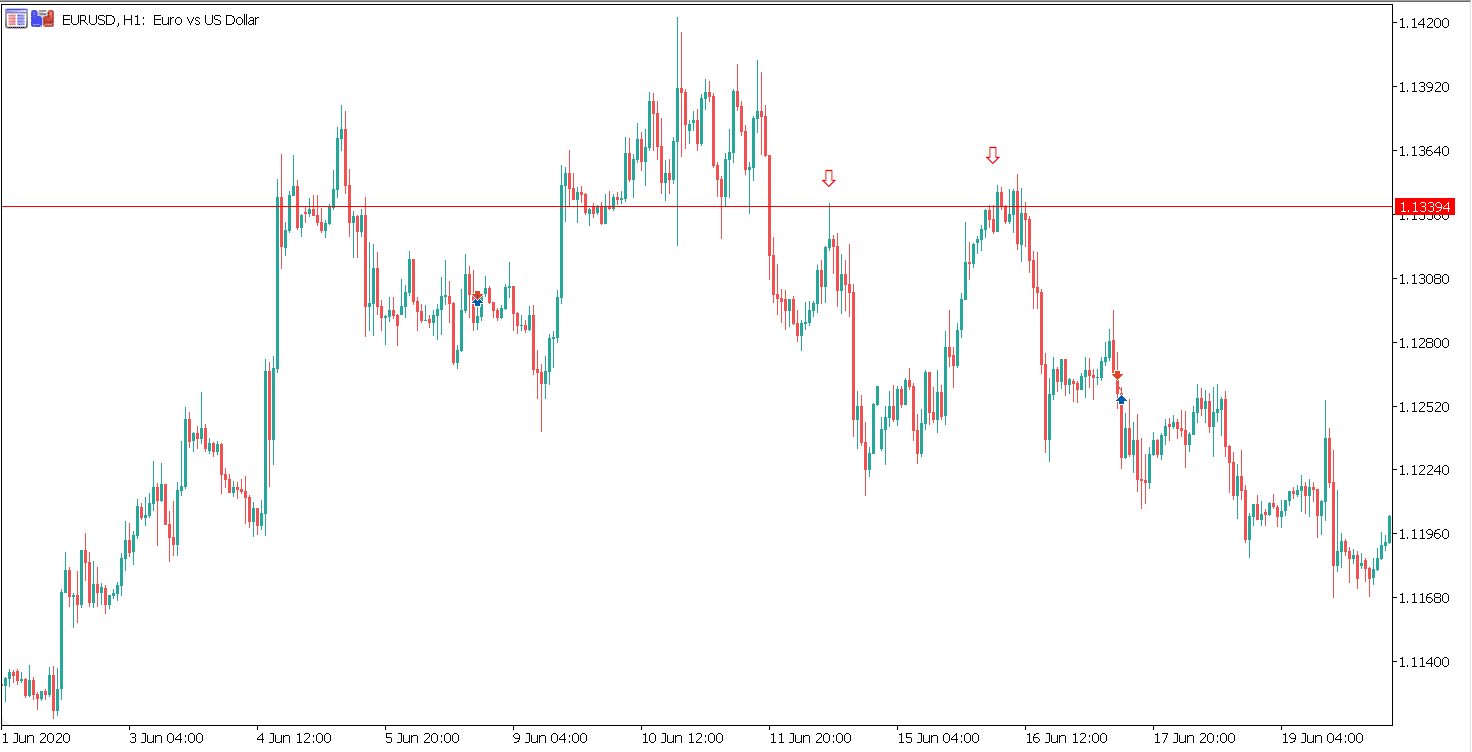
Moving the price forward, we see that the price did hold and fall from the Resistance the third time.
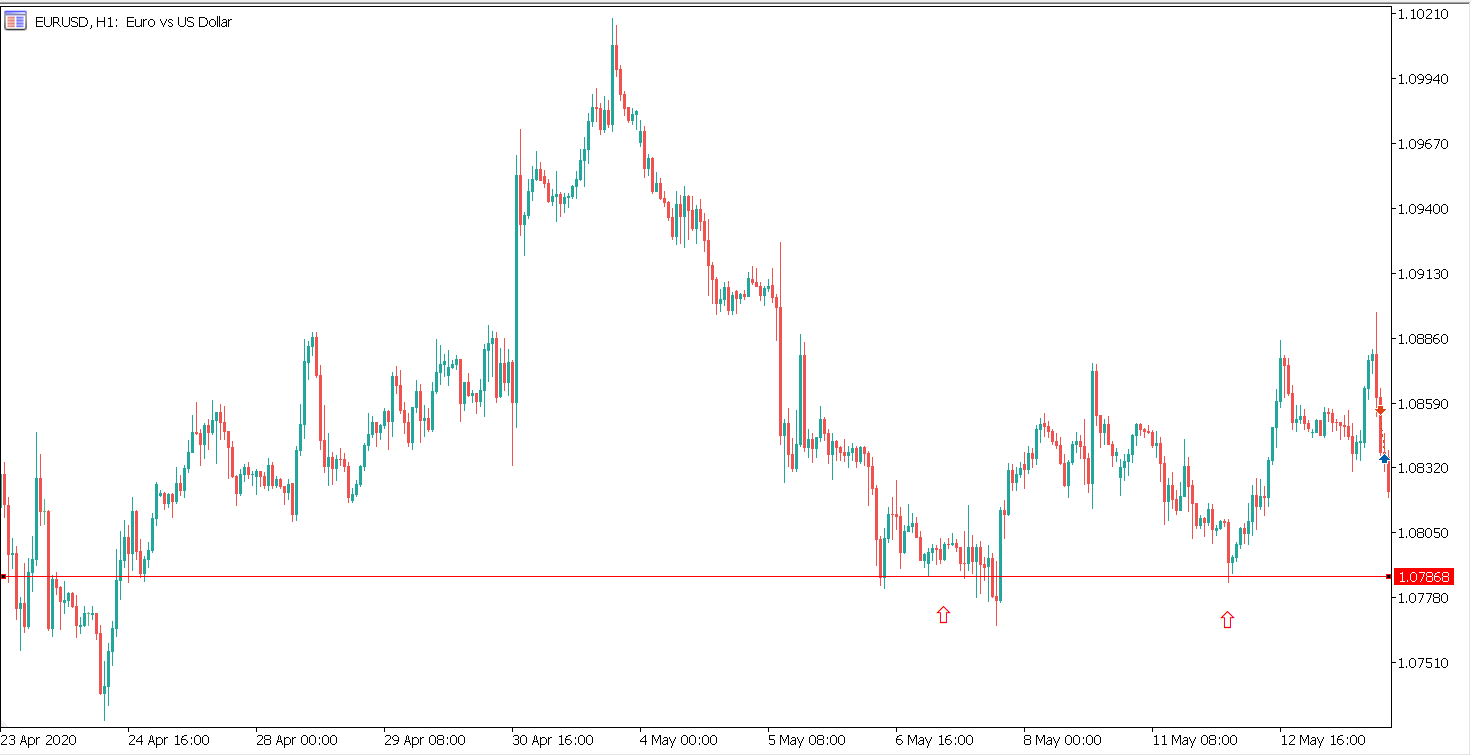
The chart below shows that the market reacted off firmly twice at the level 1.07868, indicating legitimate Support. Since the buyers were strong in terms of power and length, the level is expected to hold again.
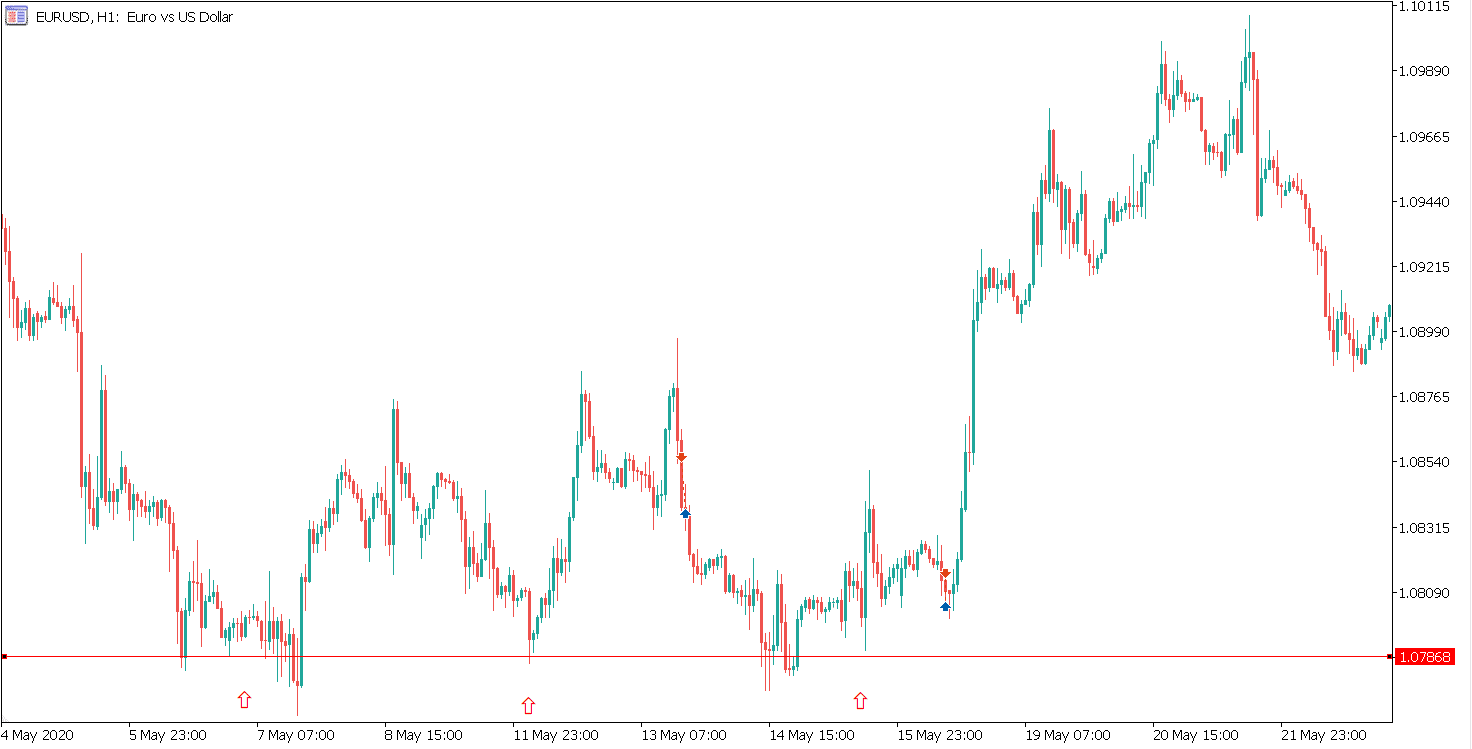
In hindsight, it is seen that the market did hold the subsequent time at the support level.
Support and Resistance Break
A Support or Resistance level does not hold forever. There will be movements when the price will break below a Support or break above a Resistance level.
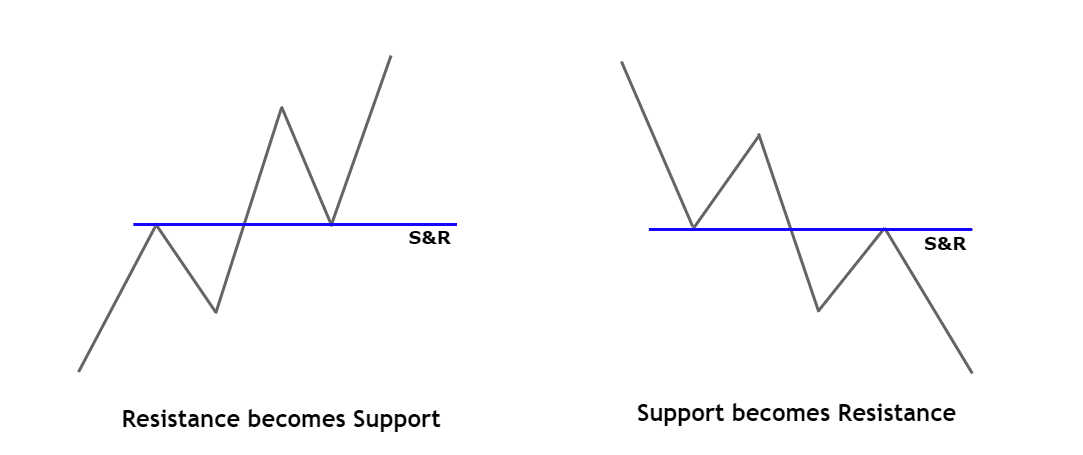
When the market breaks above Resistance, the same level now becomes a Support level.
Likewise, when the market breaks below Support, the level becomes a Resistance level.
Support and Resistance Trading Strategies
Trading Strategy 1
The first Support and Resistance trading strategy is based on a trending market.
In an uptrend, we look for buying opportunities, while in a downtrend, we hunt for selling opportunities.
This support and resistance trading strategy is centered on the concept of trend pullback. When price breaks through a Support or Resistance, we wait until the price pulls back to the broken level.
Then, using the theory of Support and Resistance and false breakouts, positions are taken in the market. Let us consider an example to understand the same.
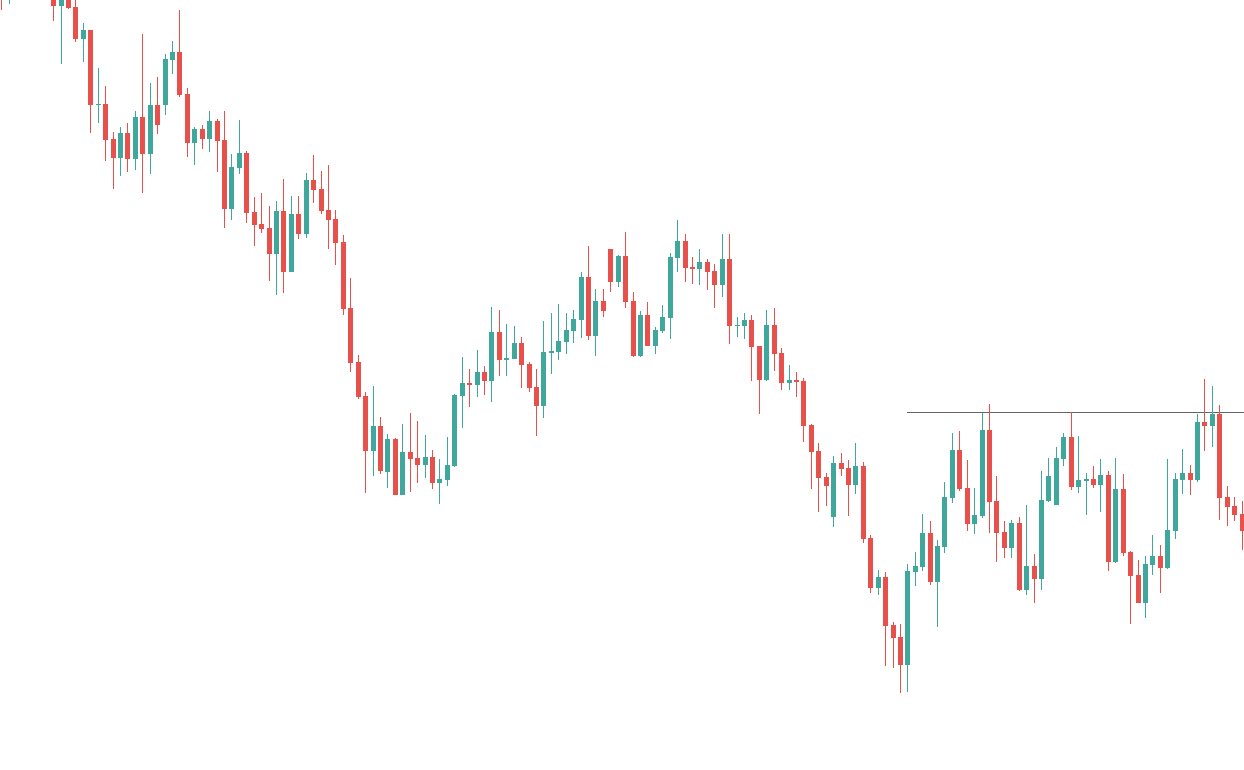
In the below chart, it is evident that the market is in a downtrend. So, spot resistance zones where the market could continue its downtrend. From the recent market price action, we see that the market found Resistance at the grey ray.
However, though the concept of Resistance indicates a sell trade, we wait for another vital confirmation.
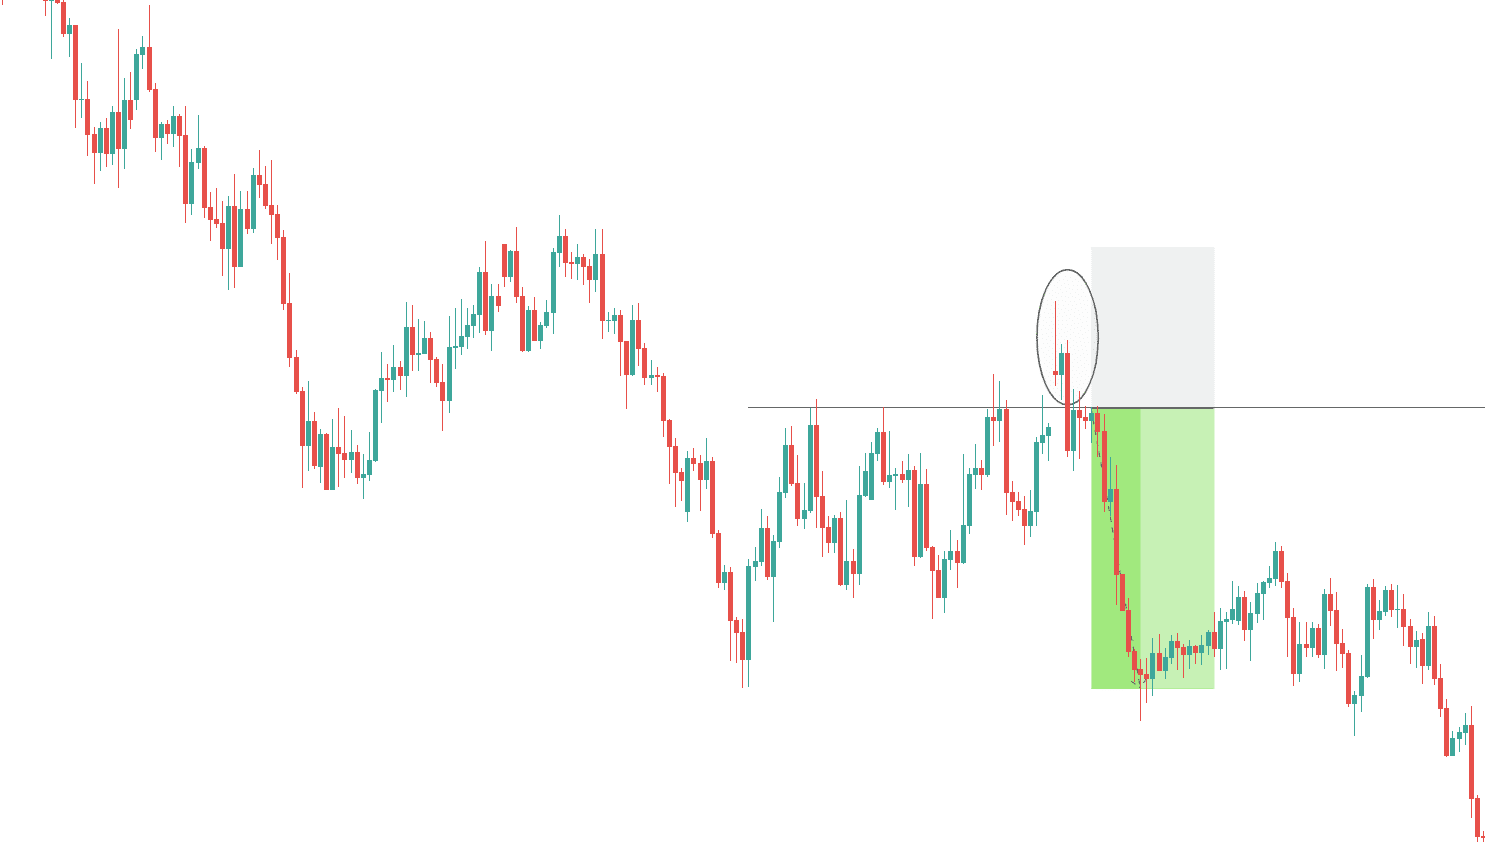
When the price is at the Resistance in a downtrend, we wait for the price to break above the Resistance, fail, and drop right back below into the broken level. Once the price holds below the Resistance, one can trigger the sell position.
The price shoots above the Resistance, but gets rejected and falls back inside the Resistance and holds. Now the overall trend, as well as the resistance level, is inclined downwards. Thus, one can short the security at the Resistance, as shown.
Stop-Loss
A stop-loss placed right above the high of the false breakout can keep a trader from getting stopped.
Take-Profit
The safest take-profit can be placed at the recent lows. If the momentum of the sellers is getting stronger, a trader could aim for much lower levels.
Trading Strategy 2
The second Support and Resistance trading strategy is based on the concept of multiple time frames and market reversals.
A couple of time frames are used in this strategy – the higher time frame to determine the forecasting direction and potential Support or Resistance level, and the lower time frame to milk the existing trend and enter precisely.
Without any more theory, let’s head to the trade example.
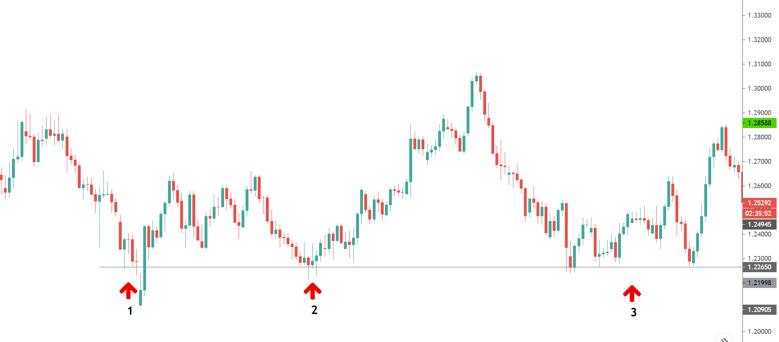
Below is the price chart of the Pound against the Swiss franc on the Daily time frame. The overall trajectory of the market is sideways.
The grey ray represents the support level, as the market successfully held thrice at the price level 1.22650.
Thus, we can expect the price to hold subsequently as well. To get an added confirmation and ideally trigger the order, let’s go lower a time frame.
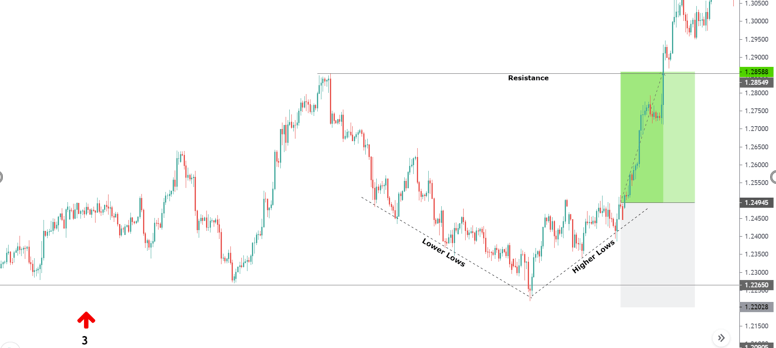
Below is the same chart on the 4-hour time frame. Focusing on the market from August, the market began to fall aggressively, making lower lows and lower highs.
In late August, the market reached the Daily Support, and the price reacted up sharply.
Following the buyers' strong reaction at the Support, the price started to make higher lows sequences. A higher low signifies that the big buyers are buying the currency at many high prices.
Considering the sharp reaction from the Support and the price action showing higher lows, one can open long position on GBP/CHF.
Stop-Loss
A logical stop loss for such trade set-ups would be a few pips below the support level. After some experience, it can be pushed higher – right below the recent higher low.
Take-Profit
Since the price 1.28549 is a critical supply zone, the take profit can be placed at these levels. Given the momentum of the buyers, one can ride their trade too much higher levels as well.
Using a Custom indicator to Plot Support and Resistance Levels Automatically
There are several trading concepts, but Support and Resistance stand to be the most crucial in technical analysis.
Many novice traders enter the market without any strong technical background. Besides, some experienced traders still find it challenging to mark support and resistance levels correctly.
Considering this, we have designed an algorithm that automatically plots significant Support and Resistance levels on the chart.
The KT Support and Resistance indicator remove the opacity on different ways to plot S&R levels and automatically draws these levels following a robust algorithm that uses a unique multiple-timeframe analysis.
Precisely, it immediately scans the significant levels in every available timeframe and puts it forth on the charts for simplified analysis.
Types of S/R Levels plotted by the indicator
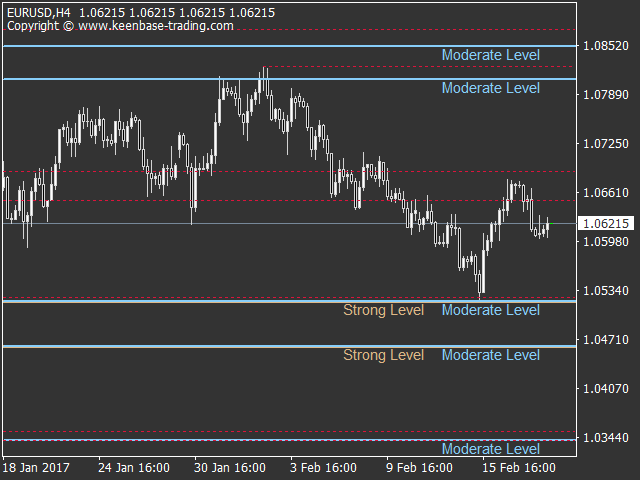
The KT Support and Resistance indicator plot four types of S/R levels based on the levels' strength. The four levels are ranked and named as:
Super Strong Levels
These levels are the most substantial levels among all. Price is very likely to respect "Super Strong Levels" and often bounce back after testing them.
Strong Levels
These are also substantial levels and price often respect them but not as much as their predecessor. If price breaks them with a significant margin, you can expect a continuation in the same direction.
Moderate Levels
If you are a day trader, you should keep an eye on these levels. Immediate trade entries around these levels should be avoided to prevent unnecessary losses.
Short-Term Levels
These are comparatively weaker levels plotted using a singular time frame analysis. If you are a day trader or scalper, you may use these levels to decide a stop loss and profit target.
A Simple Breakout Strategy using the KT Support/Resistance indicator
Trading breakouts is one of the most popular and reliable trading strategies using support and resistance. However, the strategy works only if the levels are drawn correctly.
With that said, traders can be assured about the support and resistance levels using the KT Support and Resistance indicator. It filters out the insignificant levels that have lower possibilities to hold.
Following is a support and resistance trading strategy that is designed using this automated indicator.
The strategy is based on the break of support and resistance levels. When the market breaks above or below a potential S/R level, we prepare to go long or short after a shallow pullback.
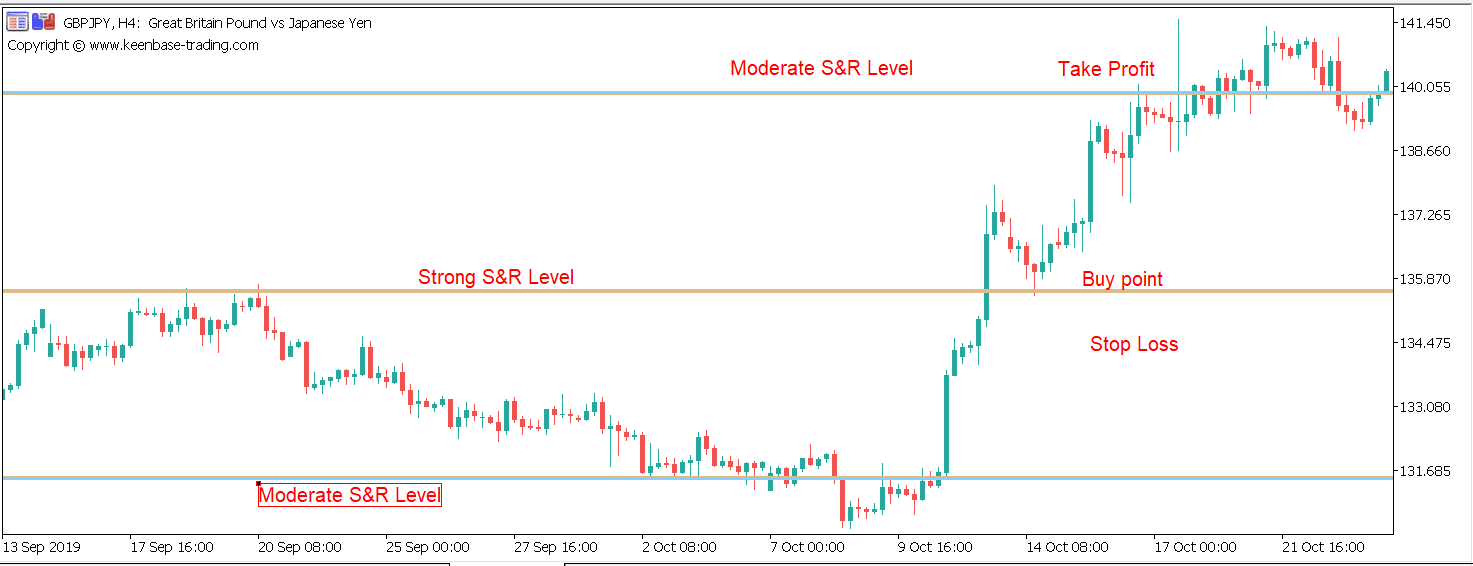
Consider the below price chart of GBP/JPY on the 4H time frame. The bottom and top levels are moderate S/R levels, while the level in the center is strong.
The market held below the Strong S/R level on 17th September and breached through it on 11th October with bullish candlesticks, indicating a strong uptrend in the market.
Also, since the price broke above a vital S/R level, traders can trigger the buy order right after the breakout.
However, conservative traders can wait for the price to pull back to the S/R level and then go long.
Stop-Loss
The stop loss must be placed a few pips below the Strong S/R level.
Take-Profit
The take profit must be placed at the most recent moderate or strong level.
Why use a Custom indicator instead of manual plotting the S/R levels?
There are several benefits of using KT Support and Resistance indicator in place of manual plotting:
Avoid the Ambiguity
Support and Resistance is a subjective concept, and there are several approaches to it. The indicator removes the ambiguity and plots only significant levels that hold the majority of the time.
Saves Time
As mentioned, the indicator automatically draws significant Support and Resistance levels, saving lots of time for traders.
Multi-Timeframe Approach
Analyzing multiple timeframes is a tedious task. This is when the KT Support and Resistance indicator comes handy as it quickly draws the S/R levels using data from each timeframe.



sounds helpful. I will definitely buy.