This indicator was built off popular tools like the RSI (Relative Strength Index) and ATR Average True Range).
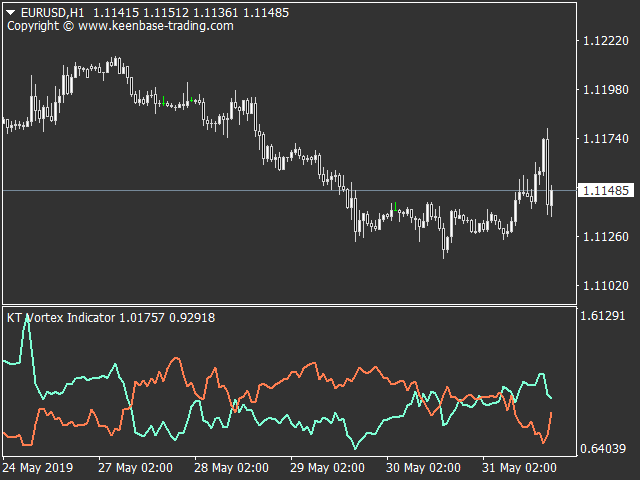
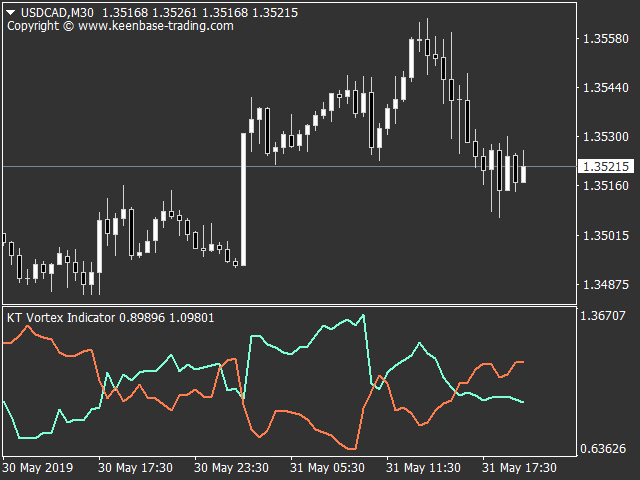
The Vortex consists of two oscillating ‘VI’ lines, each identifying positive and negative trend movement. Each line in the calculation of the Vortex consists of a 14-day moving average of the high/low price bars.
It helps you identify the start of trends; a buy signal happens when the +VI line intersects above the -VI line; the opposite is valid for a sell signal.
Building Blocks Behind the Vortex Indicator
It has two fundamental building blocks:
- True Range (TR) is defined as the highest between:
- Current high minus prior candle’s low.
- Current high minus the previous candle’s close.
- Current low minus the previous close.
- Vortex Movement (VM).
- VM+ = Absolute value of current high minus low to the prior candle.
- VM- = Absolute value of current low minus high to the previous candle.
The entire calculation details are here.
Key Uses for Market Open Traders
Many traders pay close attention to either of the four main forex sessions, noting where the trading activity is the highest. Observing a particular period's opening can offer insight into the likelihood of a sustained down or up movement.
Depending on the price movements, the Vortex indicator VI cross could mean a market may likely trend up or down for an extended time.
Also, the space between the two lines has significant meaning; the further apart they are, the stronger the trend's strength.
Key Uses for Post News Traders
You typically look at indicators offering exit triggers when you have a live position after a news event. In this scenario, the KT Vortex Indicator is suitable.
Like in the last section, traders can look for VI crosses to signal when to close their orders.
For instance, if the +VI crossed above the -VI in a short position, this could suggest a signal to exit the market; and vice versa for a long position.
Key Uses for General Pattern Traders
Traders seek further confirmation factors even when a particular pattern has formed in the market. The Vortex may work here by looking at the VI crosses.
For example, in a bullish pattern, one could wait for the +VI to cross the -VI before entering.
Combine the Vortex Indicator with Other Indicators
Like any tool, the Vortex is best utilized with other indicators to increase the overall success rate of your trades.
Summary
The KT Vortex Indicator leaves little room for ambiguity. It helps you read the financial markets to get bullish or bearish biases at a glance.
Yet the Vortex is still relatively new compared to other tools that have existed for decades. Why not try out this undervalued indicator in a demo trading account to see if it works for your trading?
