Applications
- For Murrey Math lovers, this is a must-have indicator in their arsenal.
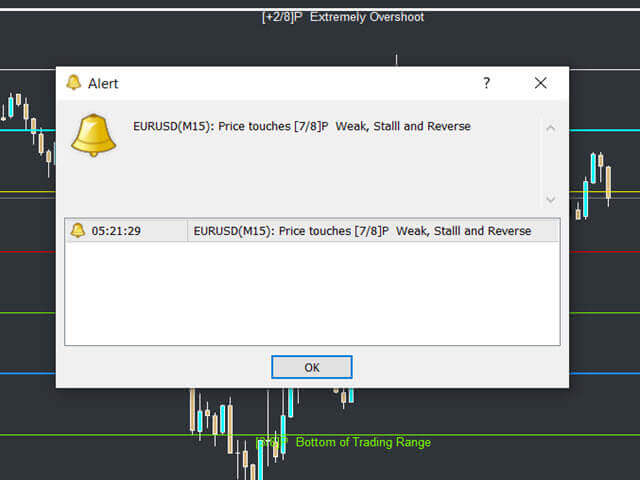
- There is no need to be present on the screen all the time. The indicator will send an alert whenever the price touches a level.
- Set upcoming reversals in advance by speculating the price reaction around extreme overshoot levels.
Understanding the Murrey Math Levels
Murrey Math's trading system is based on the assumption that price behaves the same in all markets; that's why different markets have similar characteristics.
Murrey Math divides the prices into 1/8 intervals. The basic concept of the Murrey Math Trading System is that the price movement of a market usually retraces in multiples of 1/8 to 8/8.
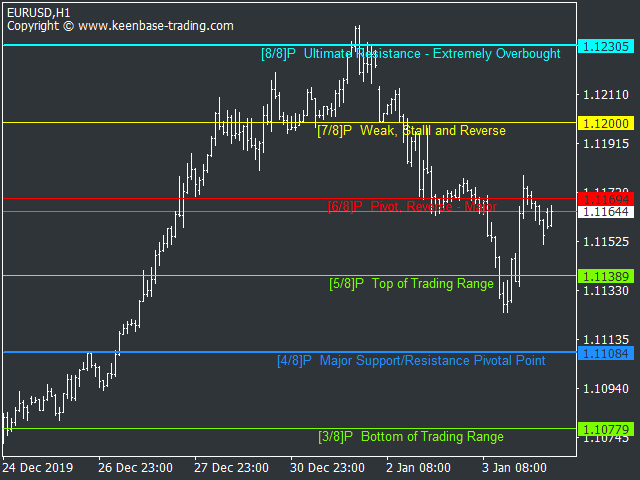
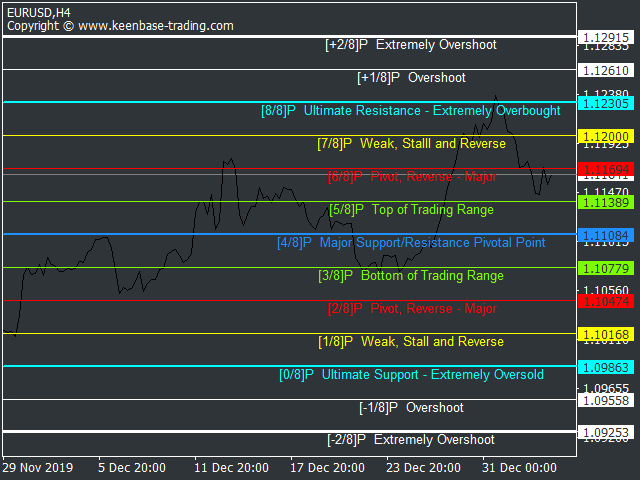
There are total Thirteen Murrey Math levels:
- [-2/8]P Extremely Overshoot
- [-1/8]P Overshoot
- [0/8]P Ultimate Support - Extremely Oversold
- [1/8]P Weak, Stall and Reverse
- [2/8]P Pivot, Reverse - Major
- [3/8]P Bottom of Trading Range
- [4/8]P Major Support/Resistance Pivotal Point
- [5/8]P Top of Trading Range
- [6/8]P Pivot, Reverse - Major
- [7/8]P Weak, Stalll and Reverse
- [8/8]P Ultimate Resistance - Extremely Overbought
- [+1/8]P Overshoot
- [+2/8]P Extremely Overshoot
While every level has its significance, Murrey Math traders believe that the market reverse 95% of the time when price cross above or below the [2/8]P Extremely Overshoot level.
Input Parameters
- Octave Period: Number of bars to calculate the price range for Murrey math levels.
- Time-Frame: Select the time frame.
- Shift Back: Shift back in bars to avoid the repaint of levels when price make a new high/low.
- Levels Color: self explanatory.
- Levels Width: self explanatory.
- Alert Settings: self explanatory.
WD Gann's observations inspired the Murrey Math discovery in the first half of the twentieth century. Gann's theory employs a geometric system to describe market price movements over time.
T. Henning Murrey developed the Murrey Math indicator, making Gann's complex trading techniques much more accessible and easy to apply.
Murrey Math’s geometry is exquisite in its simplicity, making the Murrey Math trading system an ideal candidate for an automatical fractal trading system.
Calculation and Components
The price movement segment calculates the Murrey Math line X, divided into nine sections according to Gann. As a result, the indicator has nine levels of 0%, 12.5%, 25%, 37.5%, and 50%. 62.5%, 75%. 87.5%, and 100%.
Features
- It applies to all bar types and time frames.
- Suitable for various markets such as stocks, commodities, and Forex Trading
- Labels, colors, and lines can all be customized.
- It's not necessary to constantly be in front of the screen. The indicator will send an alert whenever the price reaches a certain level.
- Works excellent when combined with the volume analysis.
More Applications
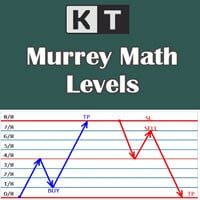
The KT Murrey Math indicator generates precise buy/sell signals and support and resistance levels where you can place your stop loss or take profit. The Murrey Math Strategy's default buy/sell signal rules are as follows:
- Buy Signal: If the market breaks below the pivotal lines of [4/8]P, buy the breakout with a protective stop loss order 10 pips below the [2/8]P. Profit should be taken once the [6/8]P is crossed.
- Sell Signal: If the market breaks from above the [4/8]P pivotal point, sell the breakout using a protective stop loss order 10 pips above the [2/8]P and take profit at the [6/8]P.
It’s important to note that you only buy or sell the breakout of the [4/8]P pivotal point if the market has spent enough time below or above it, at least two periods for the trading signal to be valid.
If the price breaks the [4/8]P pivotal point multiple times back and forth, wait until the price sustains on one side of Murrey’s line before trading the breakout.
The preferred settings for the Murrey Math MT4 indicator are the default settings. The indicator has nine main components or variables plus four extra levels that express extreme overbought or oversold conditions.
Suggestions for Complementary Indicators/EA
The Murrey Math MT4 Indicator can be used independently or with other indicators, such as the KT Auto Fibonacci level Indicator, a great tool to use with the KT Murrey Math lines, which can be accessed at this link: KT Auto Fibo indicator.
Conclusion
A trading method using the Murrey Math and Pivot levels can be exciting and unique and may be combined with your existing knowledge. You can use both of these indicators in all time frames.
You can try it with a demo account to understand how to incorporate it into your trading strategy.
