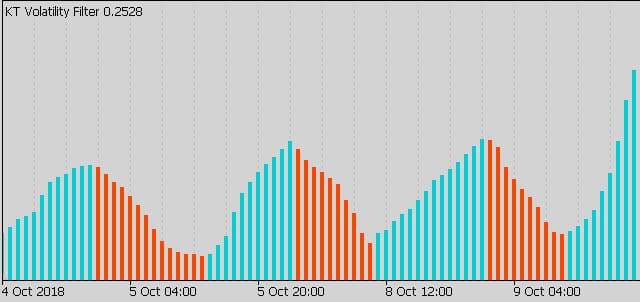
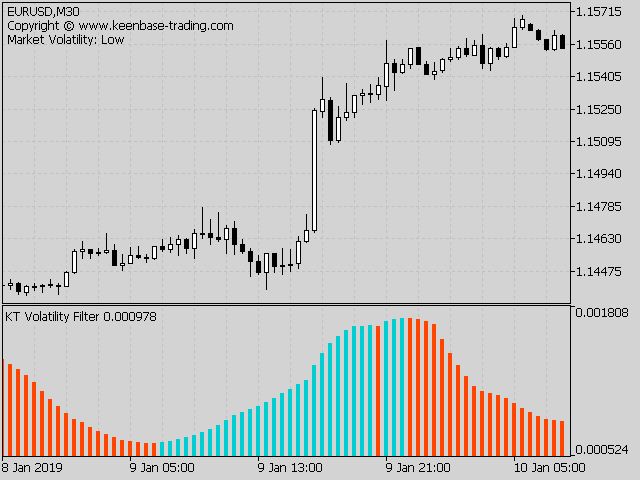
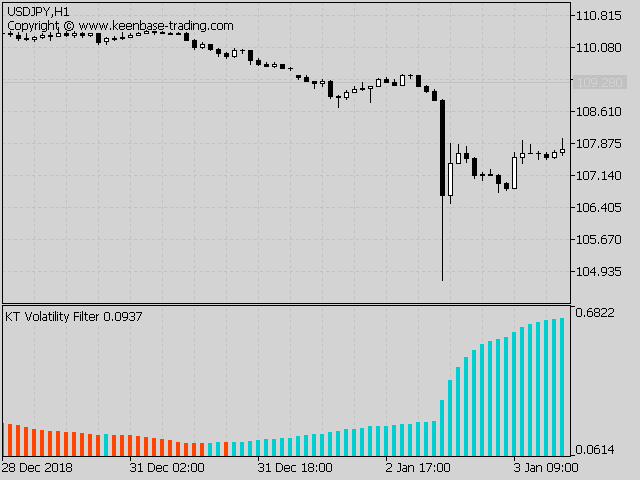
High Volatility
- Trend-based systems are more successful in highly volatile markets, encouraging investors to hold onto their positions until the trend reverses.
- Breakout systems can fetch more pips from the market if the breakout happens during high volatility.
Low Volatility
- Mean reversion systems work great in low volatility because of the mean reverting nature of markets.
- Channel-based systems such as Donchian channels perform more effectively during periods of low volatility.
Directionless Indicator
It's a directionless oscillator that doesn't correlate with the bullish or bearish nature of the market. However, the rising volatility index can be related to both market states, i.e., bullish and bearish sentiment.
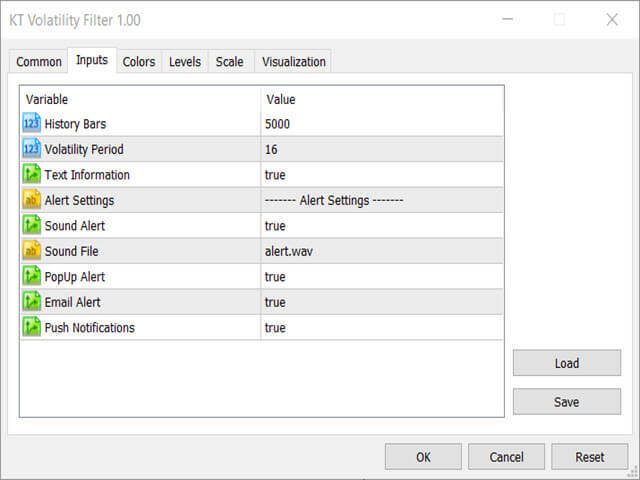
Inputs of Forex Volatility Calculator
- Volatility Period: An integer value to decide the calculating period.
- Text Information: Show/hide the information text on the chart.
- ----- Alert Settings -----
- Sound Alert: true/false
- Display Box Alert: true/false
- Email Alert: true/false
- Push Notifications: true/false
Measure Volatility in Forex Market
Forex volatility indicators helps trade more effectively and keeps expectations aligned with reality. The volatility is essential to consider to trade the currency pairs successfully.
Volatility measures how rapidly prices change in a market. A volatile market is one with frequent price movements. Conversely, price changes are moderate in a steady market.
Different Types of Volatility
To make matters even more complicated, market participants may be referring to slightly different things when they discuss volatility.
Regardless, our general notion of volatility calculation - the rate at which a market fluctuates - remains accurate. Having stated that below are some of the numerous interpretations of volatility:
- Volatility in the past was based on actual price changes
- Forex volatility can show the future market's movement.
- Forecast volatility is a prediction of future volatility.
- Implied volatility is a term used in option pricing.
Suppose you're wondering which other indicators are available to assess the market volatility. In that case, the answer is that there are several indicators to depict the volatility:
- The SAR Parabolic indicator.
- Momentum indicator (also known as the Rate of Change).
- Average True Range (ATR).
- Standard Deviation.
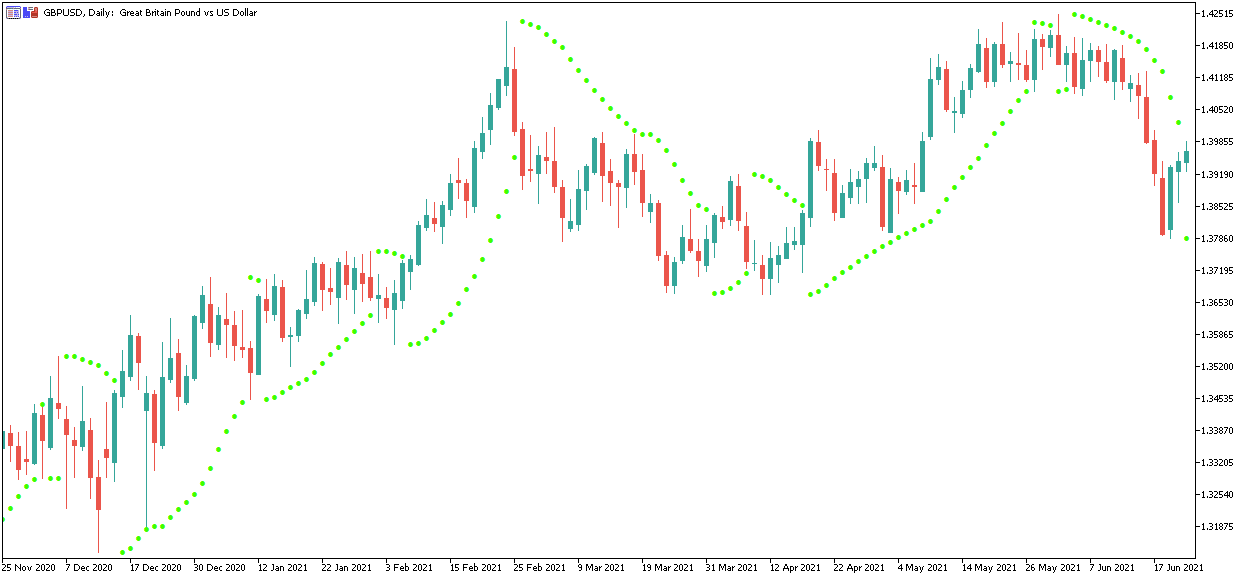
Parabolic SAR
J. Welles Wilder, a prominent developer in the field of technical analysis, created the Parabolic SAR indicator. 'Parabolic Stop and Reverse' refers to the indicator's attempt to find suitable entry and exit points for trades.
Forex Momentum Indicator
The momentum indicator is included with the MetaTrader trading platforms. It is often referred to as the Rate of Change indicator (or ROC). This statistic measures the rate at which movement changes.
The chart below shows the GBPUSD pair with the momentum indicator plotted as a Forex volatility chart.
Volatility Channels
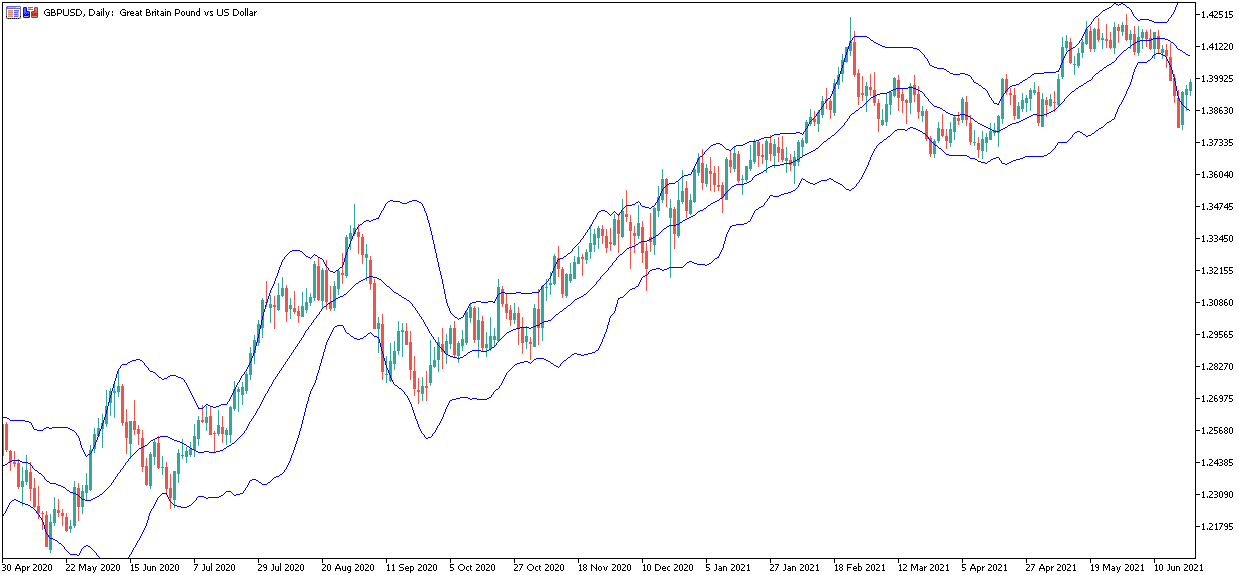
Volatility channels are a sort of indicator that plots lines impacted by Forex volatility above and below the market price.
Channels, envelopes, and bands are all names for these lines. They broaden when volatility rises and contract as volatility falls.
Bollinger Bands and Keltner Channel Indicator are popular among Forex traders.
Keltner Channel, a combination of moving average EMA and ATR, analyses price movements to the upper and lower bound of the moving average.
Keltner's channel is similar to Bollinger Band, but Keltner is narrower and more consistent. A Forex trader needs to observe the price movement if it goes above or below the Keltner Channel lines.
These standard deviations are the trading ranges where you can make a profit during forex trading.
Standard Deviation?
The standard deviation measures the variation or dispersion of a set of values.
A low standard deviation indicates that the data set's numbers are close to or less volatile. A large standard deviation indicates that the data is more uncertain and volatile.
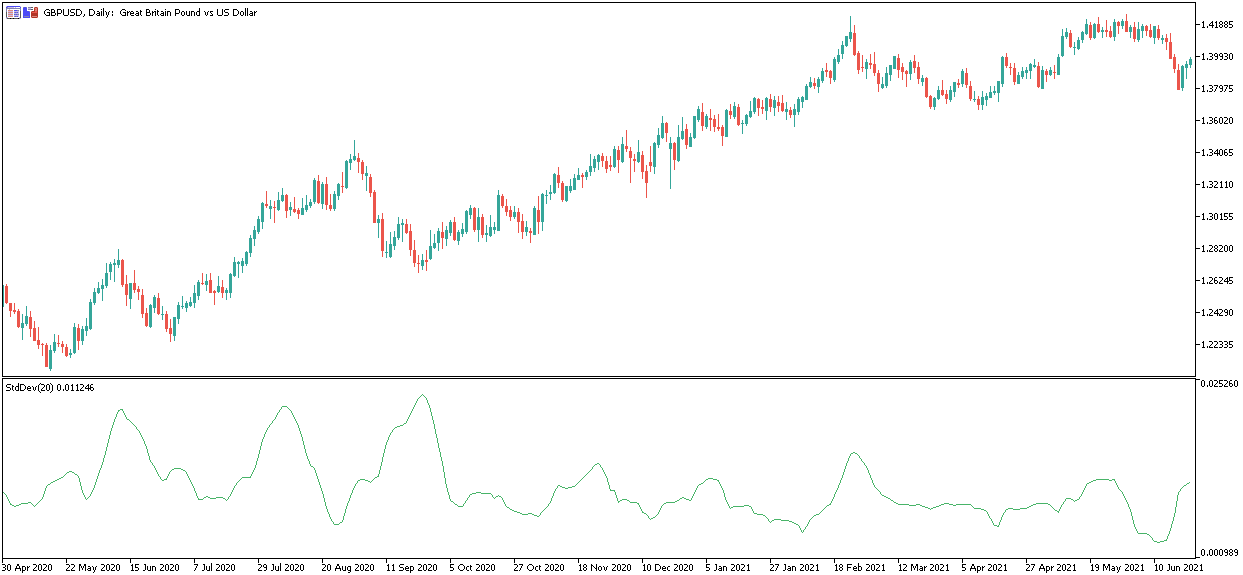
The Standard Deviation indicator is a valuable tool for visualizing the level of volatility in a specific Forex currency pair.
It is included by default in both MetaTrader trading platforms. For example, a GBPUSD chart with the Standard Deviation indicator is shown below:
Volatility Squeeze
The Volatility squeeze indicator is used to identify the possibility of a breakout opportunity for a currency pair. It is a combination of Bollinger Bands and Keltner Channel. On average, Bollinger Band sits outside of the Keltner channel.
However, a period of consolidation may pull the Bollinger Band in, thus showing a narrowing indicator of reducing volatility. Using the Keltner channel, we can get context and predict future breakouts.
Conclusion
Market conditions can be difficult, as price movements are hard to predict. Picking a trading strategy can also be tough.
So how do we overcome this challenge to get the right price for forex traders? In addition, how do we measure the volatility of forex trading?
For short-term traders, it works as a currency volatility meter which helps to understand the market volatility and make decisions accordingly.
The forex market sways a lot, and the standard deviation may or may not be consistent daily. There is no guarantee that the standard deviation will remain constant after a breakout.
