Formula to Calculate the Average Daily Range
The calculation of a currency pair's daily range is a simple process. But, first, calculate the difference between a currency pair's daily highs and lows.
The indicator is entirely customizable, and you can set it to consider as many periods as you want.
The formula is given below:
ADR = (D1+D2+D3+D4+ .....+ Dn) / P
Where,
D is the range covered by the corresponding days.
P is the chosen period/number of days.
The Average Daily Range (ADR) is calculated by taking the average of the range of 5 corresponding days of a currency pair. For example, if the range of 5 corresponding days of a currency pairs are:
ADR = (59 + 60 + 72 + 56 + 65)/5
ADR = 62.4pips
The indicator calculates this automatically for you. So you only have to select the period input that you want the ADR to take into account.
To find the average daily range, subtract the daily low from the daily high over a specified period.
Please don’t confuse it with the Average True Range (ATR). The ADR allows setting the stop loss and take profit at a reasonable distance according to the instrument volatility.
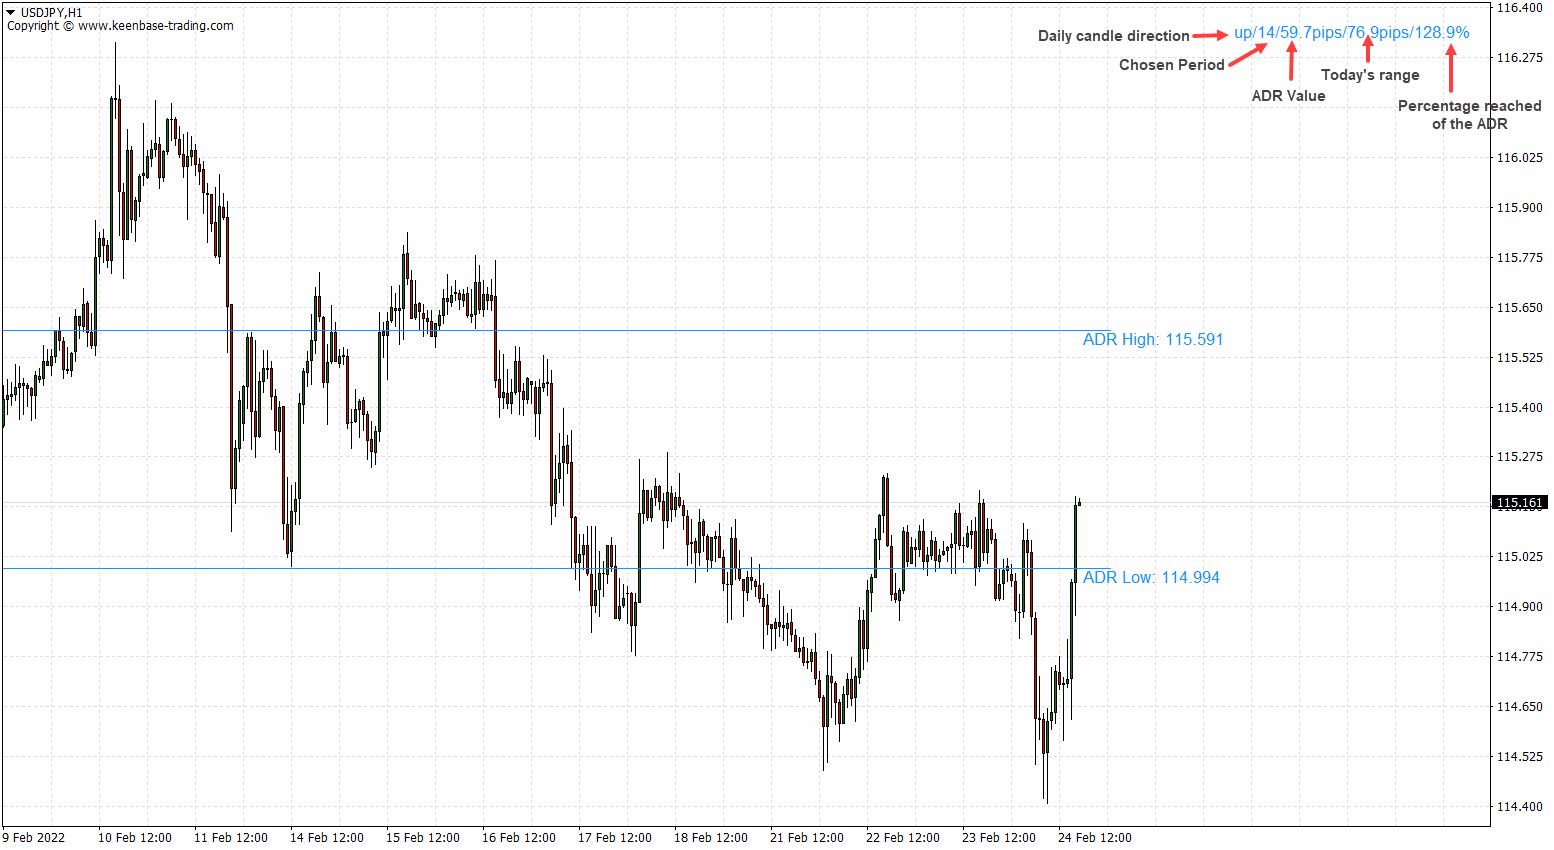
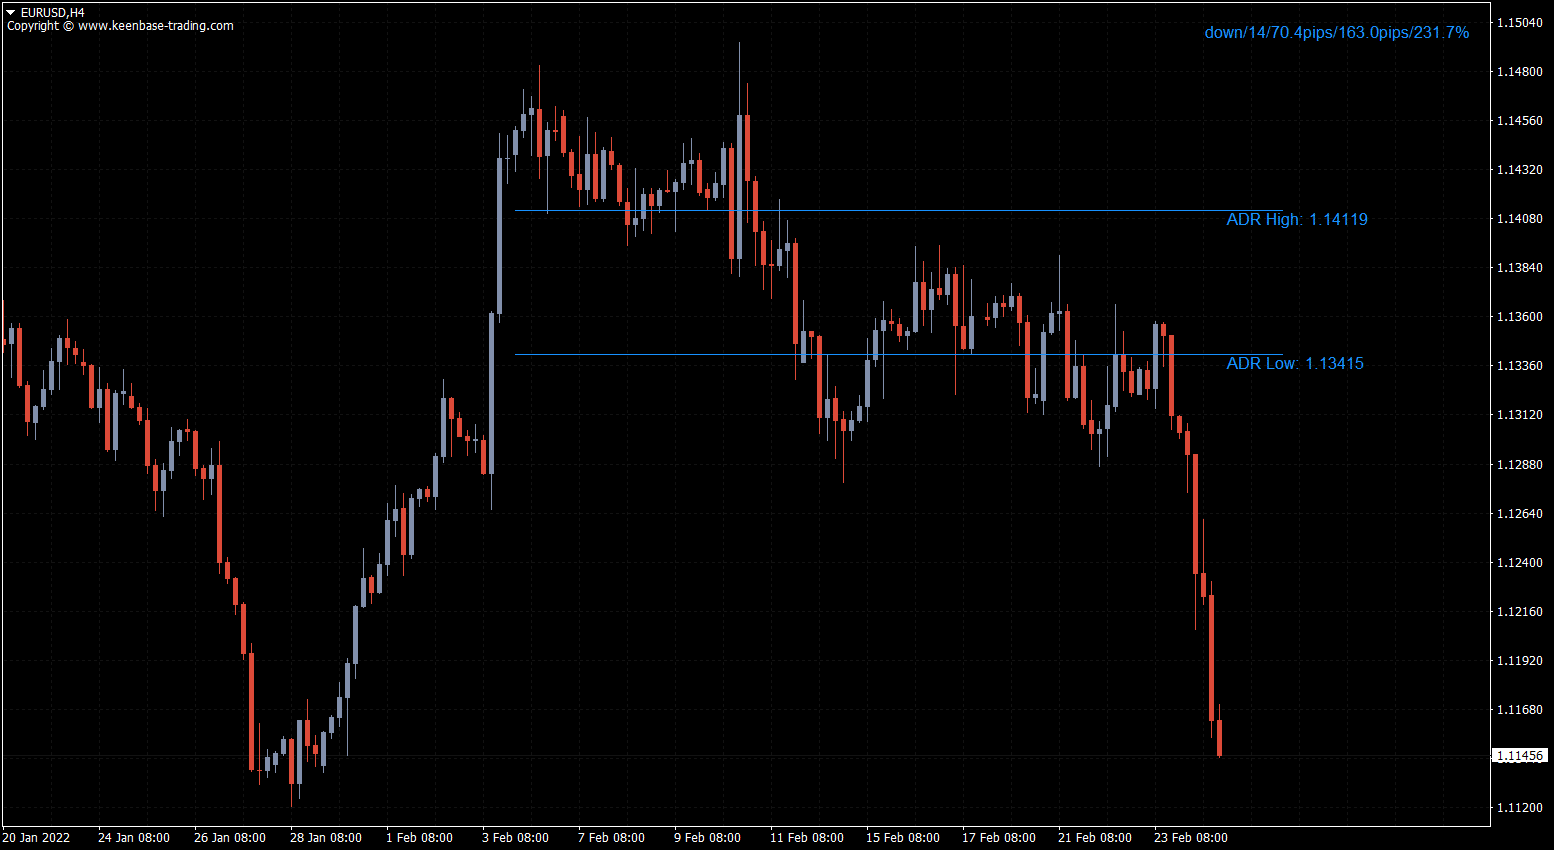
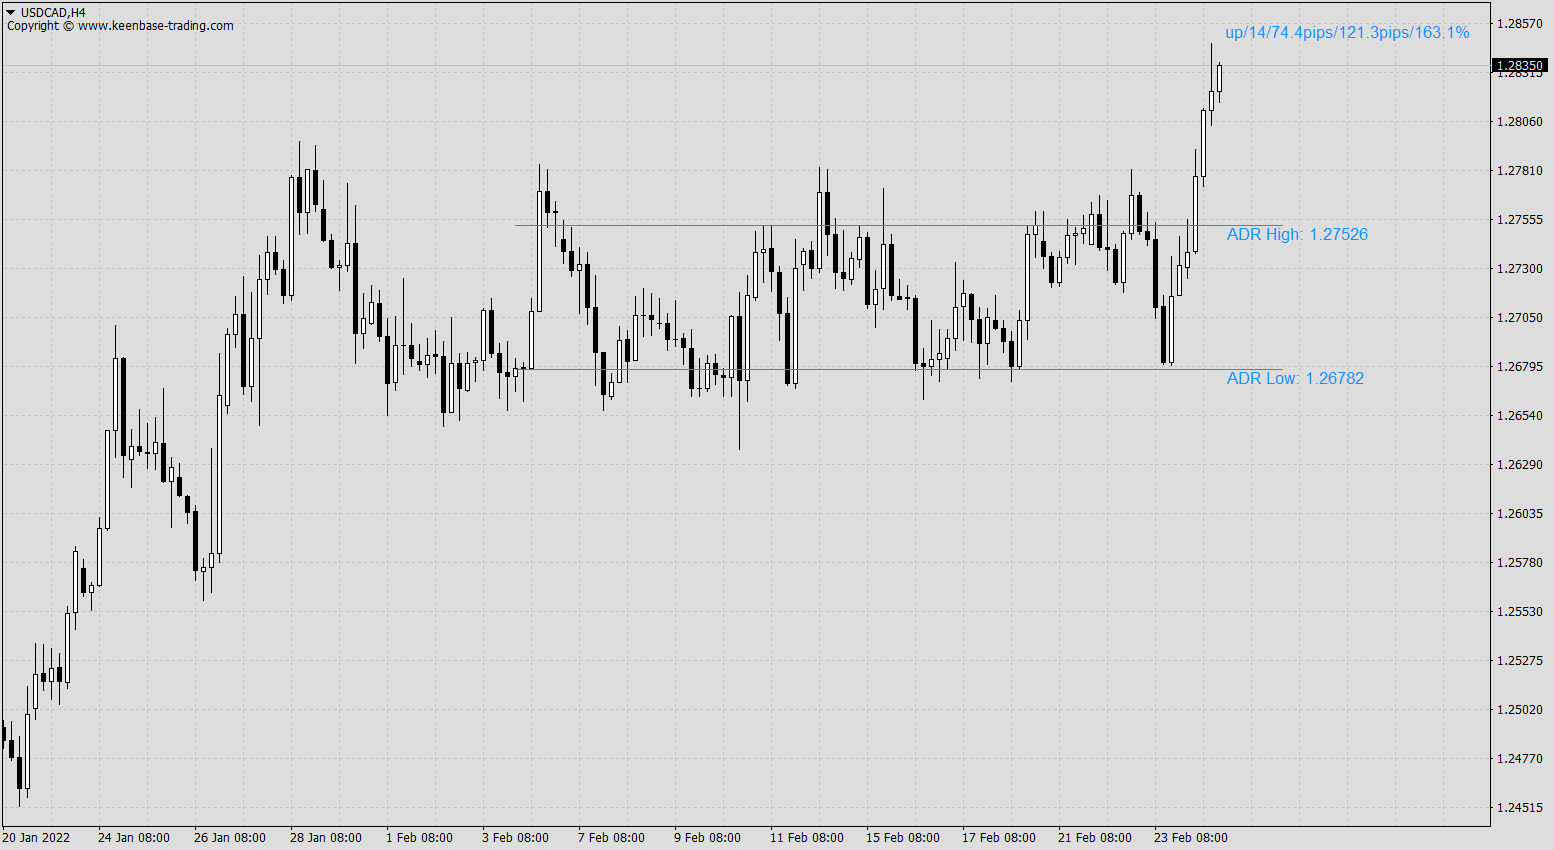
ADR High
ADR high is the upper level found by adding the average daily range value to the current day's low.
ADR Low
The lower level ADR is found by subtracting the ADR value from the current day's high.
Applications of KT Average Daily Range Indicator MT5
- The ADR levels can be used as the stop-loss and profit target.
- Traders can use the ADR indicator to design the reversal strategies using the mean reversion principles around the ADR levels.
- Sometimes ADR levels also work to identify the possible support/resistance zones.
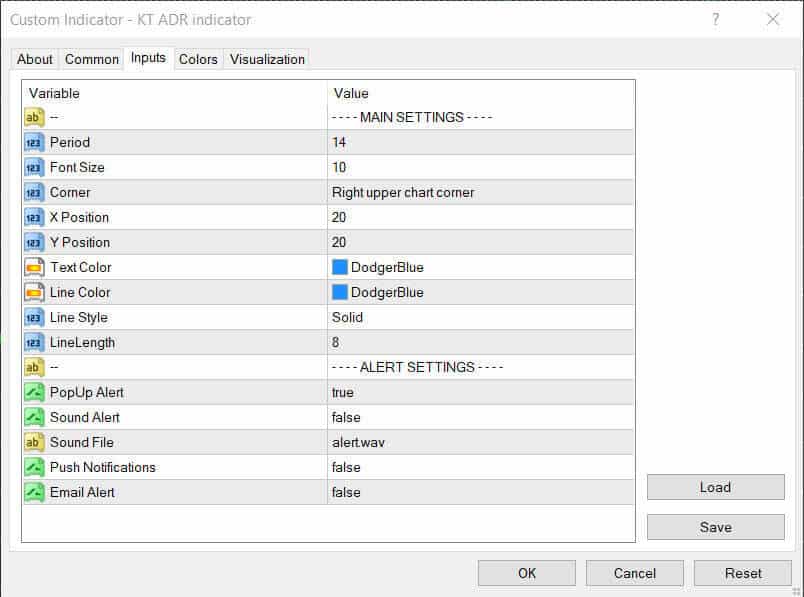
Input Parameters
Key Uses for Market Open Traders
Early trading frequently predicts what will happen later in the session. The ADR can help a trader predict the day's highs and lows, based on recent volatility.
Key Uses for Post News Traders
The volatility after the news release can potentially push the market toward the extremes. The ADR helps visualize the significant liquidity gaps created during news events that can potentially be filled in post-news price action.
Key Uses for General Pattern Traders
Even after a specific pattern has formed in the market, traders seek additional confirmation factors. A bullish pattern means the price of an asset is probably going up, so you can buy it. Once the average daily range line reaches 50-70%.
It may help you maximize profit by riding out the full moves or cutting before the reversal extremes. ADR can be used to find support and resistance levels not immediately apparent on the chart to generate trade signals.
Combining the ADR With Other Indicators
Filters are added to trading strategies to filter out low-quality trades, increase average profit, and decrease average drawdown. The ADR can be used with EMAs and SMAs as an additional filter.
Using the indicator's outputs, you can incorporate Expert Advisors (EAs) to do automated trading.
Summary
The Average Daily Range indicator marks out typical daily high and low ranges. It helps reflect the market's realistic expectations on an average day.
When combined with other technical analysis concepts, the ADR can be a valuable tool in trading. Remember to try it out on a demo trading account first to see if future results meet your expectations!


