One moving average (MA) is the high of the price over the past 10 periods, while the other is low over the same periods based on the time frame.
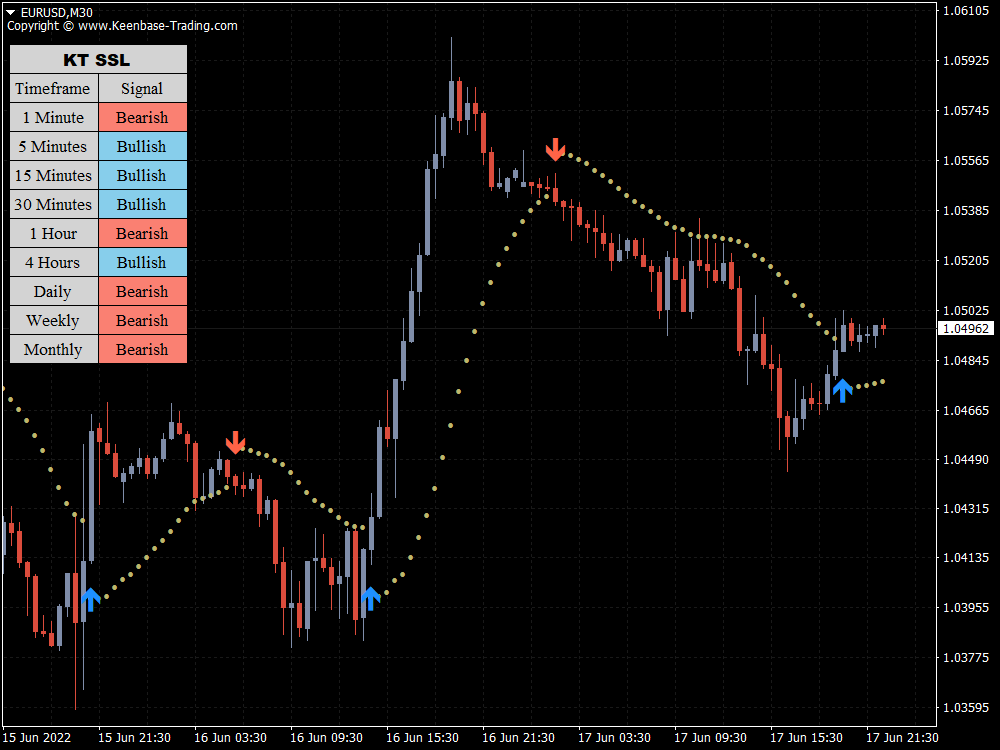
The primary aim of this tool is to identify trends. However, the classic crossover feature of moving averages can also signal trend changes. For example, when the price is above the high MA, it suggests a buying opportunity.
Conversely, when the price is under the low price MA, it indicates a selling opportunity.
The MA lines cross can be used in trend continuation and reversal trading strategies. In the former, traders can look at mean reversion and wait for the price to be above both moving averages.
One can use the crossover to confirm a potential trend change in reversal scenarios by waiting for the price to be above the low moving average but not the high moving average. The opposite applies to trading downside reversals.
Features
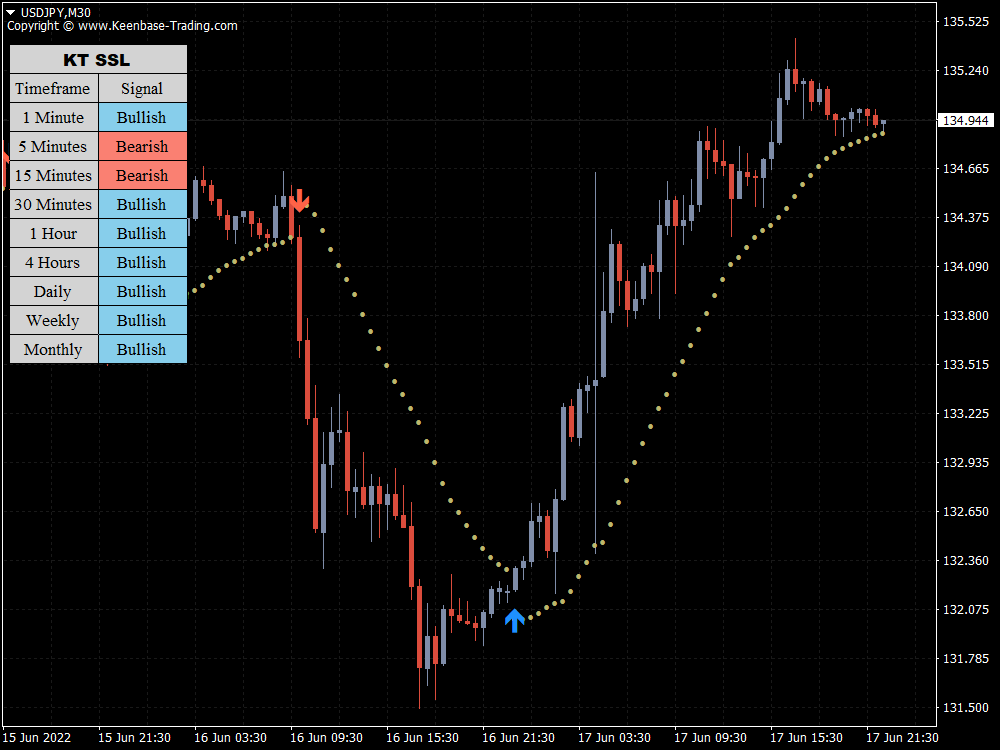
- It comes with a multi-timeframe scanner that scans for the new signals across all the timeframes.
- A straightforward personal implementation of the classic SSL effortlessly finds the trend direction.
- All MetaTrader alerts included.
- It comes with adjustable channel chart alerts.
- Has customizable input, color, levels, and visualization settings.
- Simple to use for all trading strategies.
- Works on any symbol and time frame on MT4/MT5.
- It comes with a unique multi-timeframe scanner scanning for new signals.
- The SSL indicator does not do any repainting on historical bars.
KT SSL Indicator Formula
- Upper Line: Moving average applied to the bars high.
- Lower Line: Moving average applied to the bars low.
- Buy Entry: When the price closes above the upper SSL line.
- Buy Exit: When the price closes below the lower SSL line.
- Sell Entry: When the price closes below the lower SSL line.
- Sell Exit: When the price closes above the upper SSL line.
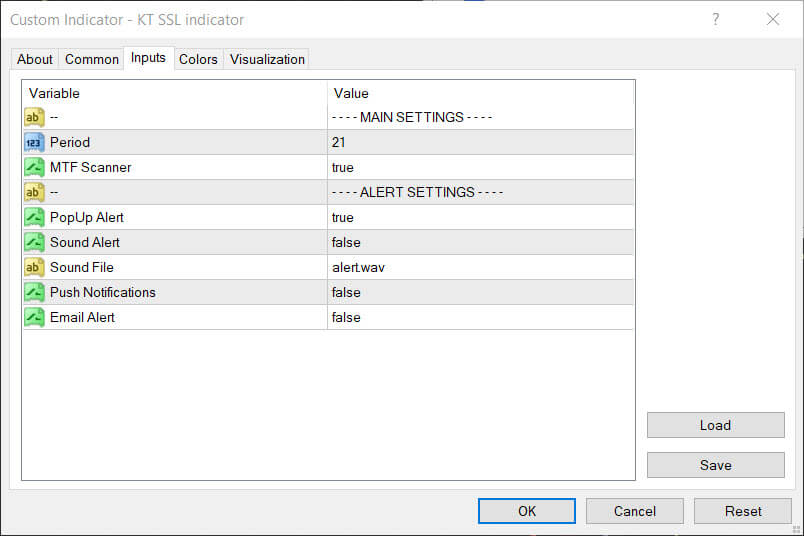
Inputs
Potential Applications
When the market opens, traders want to gauge the likely predominant direction for the trading day. The SSL channel can quickly identify the daily trends emerging from sessions open.
It can also provide exit signals when you are riding a big move, for example, a news move triggered by a central bank’s interest rate decision.
In such cases, it may be prudent to exit when the price returns between the two moving averages after being beyond both during the decisive move.
The trend bias summary view across timeframes is beneficial always to know where the market is in the big-picture opinion. This can help you determine your take profit targets more optimally.
For example, if you’re trading short on a 15-minute setup here on USDJPY, it may be prudent to close the position at a 30-minute support area as the overall trend on that timeframe is bullish.
Combine the SSL with Other Indicators
The SSL channel tells you about the strength of trends and flags changes in trend directions as the high and low moving averages overlap.
You can combine it with complementary tools such as momentum measurements (e.g., the RSI), volatility indicators (e.g., the ATR), or volume-based indicators.
These can act as additional confluence criteria to increase the trade odds. The SSL only deals with the trend but studying the momentum is beneficial.
So, for instance, once you’ve confirmed a trend with the SSL, the RSI can show where momentum is at its highest to get a more robust trade entry and exit.
Summary
Overall, the SSL indicator is helpful for fans of dual moving averages as it eliminates the need to add each one individually. As with any indicator, you must thoroughly test this one with your system before mastering it.
This is because traders can get false trading signals like all moving average systems. As a result, it will be common to notice instances where the SSL detects trend changes that don’t materialize.
So test and learn the indicator well in a demo trading account. And remember to always employ solid risk management tools by adhering to your stop loss and watching your correlation risks.


