Half Trend indicator Formula
The core trend part of the indicator is made up of a moving average. You can look at how moving averages are calculated here.
It also computes both buy and sell signals while highlighting price bars within a given timeframe. This is done via any entry/exit trigger algorithm. It uses the Parabolic SaR as the buy/sell trigger.
Features
- It is a very user-friendly and distinctive indicator.
- It can be used successfully with any currency pair and time frame.
- It provides information on both rough and smooth entries.
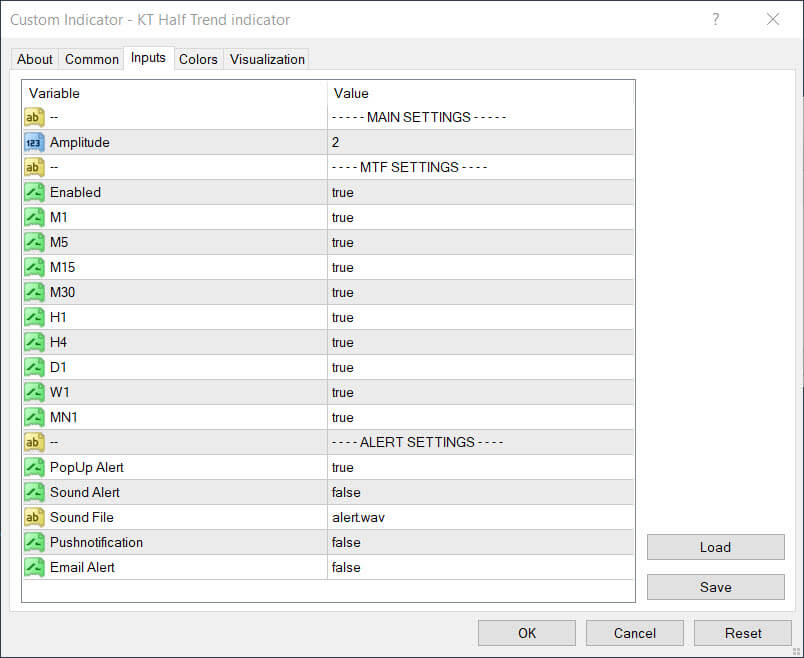
- You can customize the moving average, Parabolic SaR settings, and visual color features.
Inputs
Applications
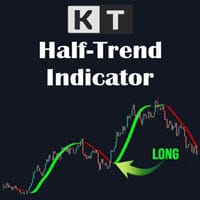
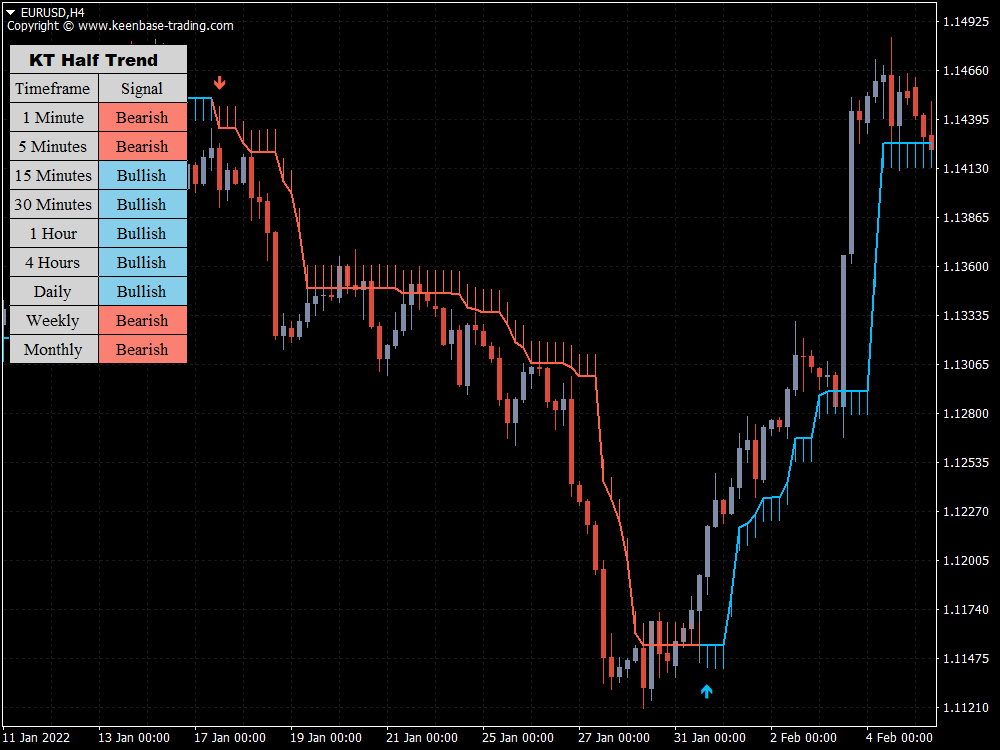
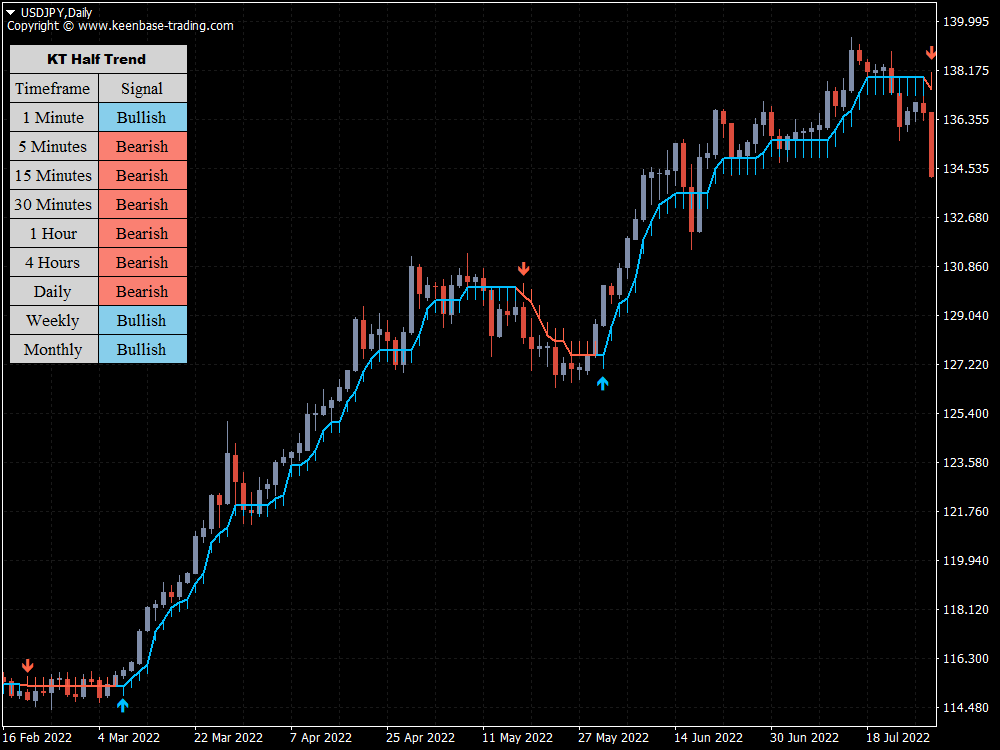
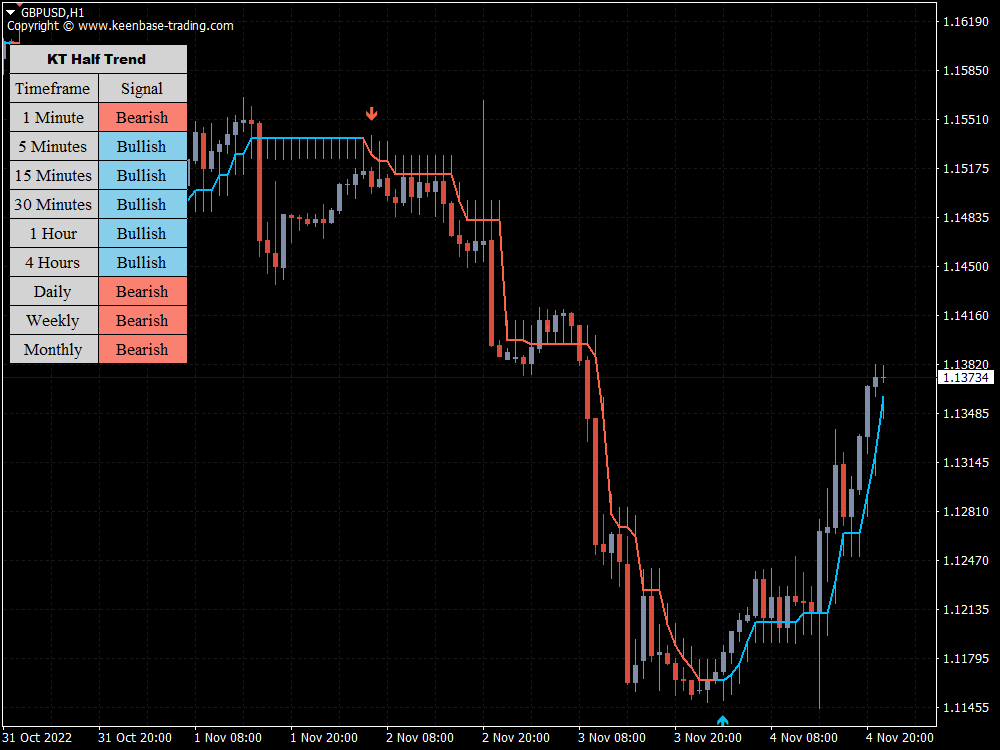
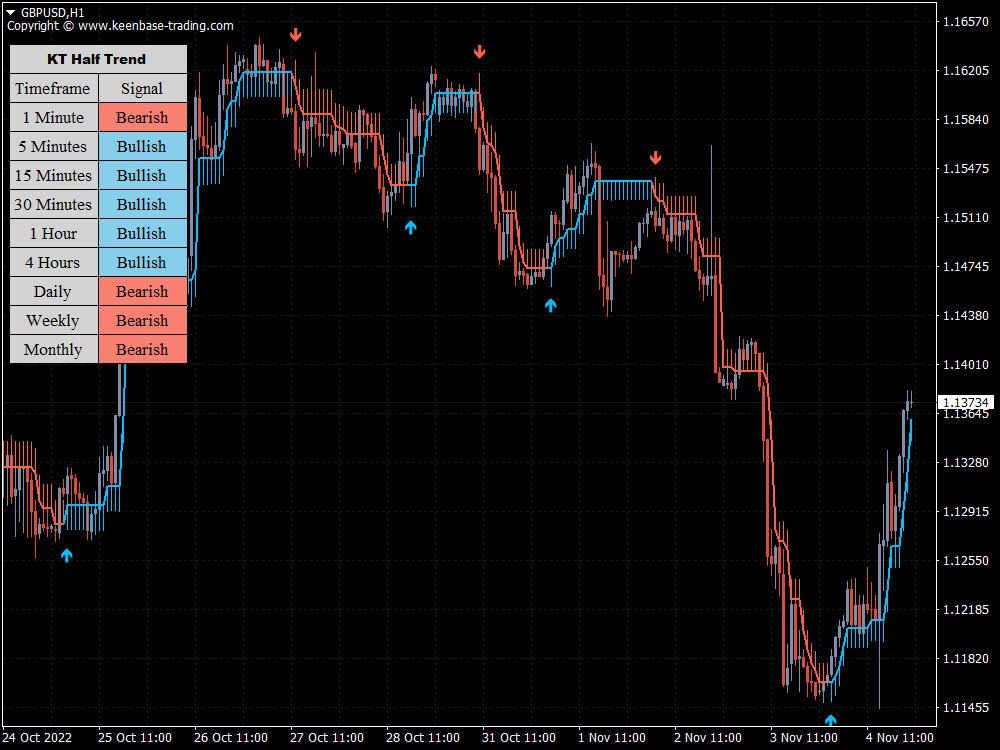
Generally, buying conditions are associated with the asset price rising above the slope of the indicator and the half trend turning blue.
Then, below the price candle, you should see a blue-colored upward candle, representing bullishness. It indicates that a stop-loss order should be placed below the indicator.
When you see a red-colored downtrend arrow showing bearishness, you should either exit your long position or place a take-profit order.
Selling conditions are generally associated with the asset price falling below the slope of the indicator and the half trend turning a bearish color like red.
Then, above the price candle, you should see a red downtrend candle. It indicates that a stop-loss order should be placed above the indicator.
When you see a blue uptrend arrow, you should see either exit with a short position or place a take-profit order.
Suggestions for Complementary Indicators/EA
The KT half trend indicator performs admirably when combined with other indicators.
Combining the KT MACD indicator with the half trend will result in an even better situation when entry signals from the first tool are combined with potential price reversal signals from the second.
Conclusion
The indicator provides all the elements required for precise trading and sound decision-making. It is simple to install on your trading platform.
You can test it out on a demo account to see how it fits into your trading strategy and whether it serves your trading purpose well.


