Calculating the Schaff Trend Cycle
The formula behind this indicator is:
Schaff and Trend Cycle = 100 x (MACD – %K (MACD) / (%D (MACD) – %K (MACD) ).
The STC calculation is based on three inputs:
Keep in mind that the short-term exponential moving average (EMA) has a default period of 23 days, and the long-term exponential moving average has a default period of 50 days.
To begin, compute all of the 23-period and 50-period EMAs, as well as the MACD values, as follows:
EMA1 = EMA (Close, Short Length)
EMA2 = EMA (Close, Long Length)
MACD Line = (EMA1 – EMA2)
Second, you must compute the 10-period stochastic from the above MACD values as follows:
%K (MACD) = %KV (MACD, 10)
%D (MACD) = %DV (MACD, 10)
Finally, once you've calculated the above values, plug them into the Schaff Trend Cycle formula to get the results.
Key Features
- The Schaff Trend Cycle indicator is an effecting trend-predicting tool that all traders, regardless of pedigree, can use.
- The STC indicator comes in an oscillator-based appearance and has two lines (25 and 75) to highlight potential trend turning points.
- The indicator is flexible; the bands and line sensitivity are customizable to fit user preference.
- The STC can be combined with other technical analysis indicators and most trading strategies to yield better trading results.
- The Schaff Trend Cycle is suitable for all trading time frames.
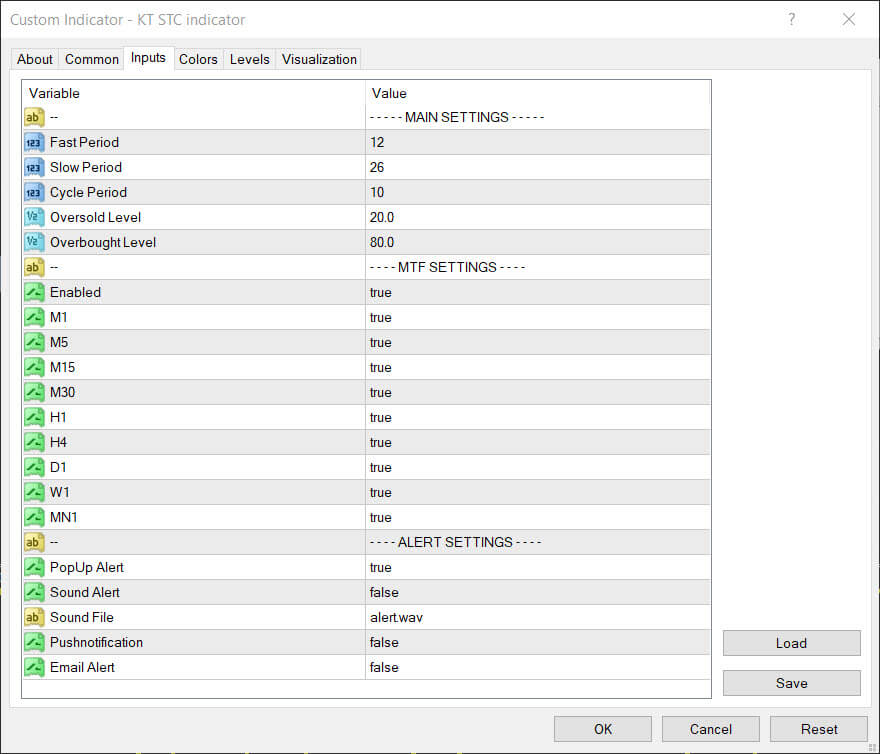
Inputs
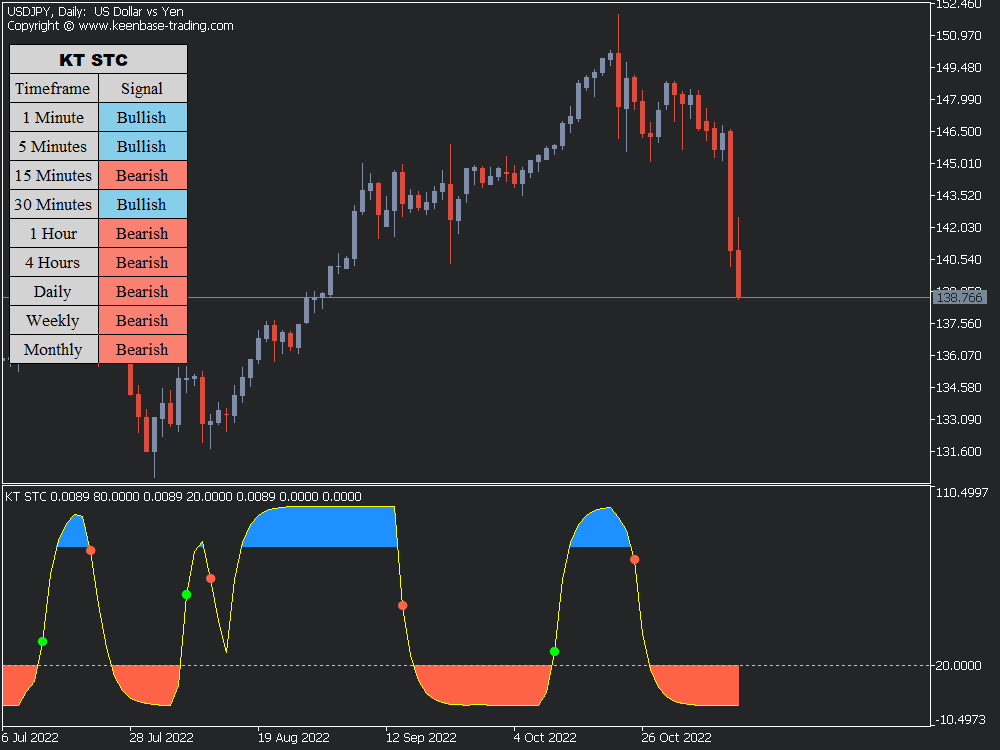
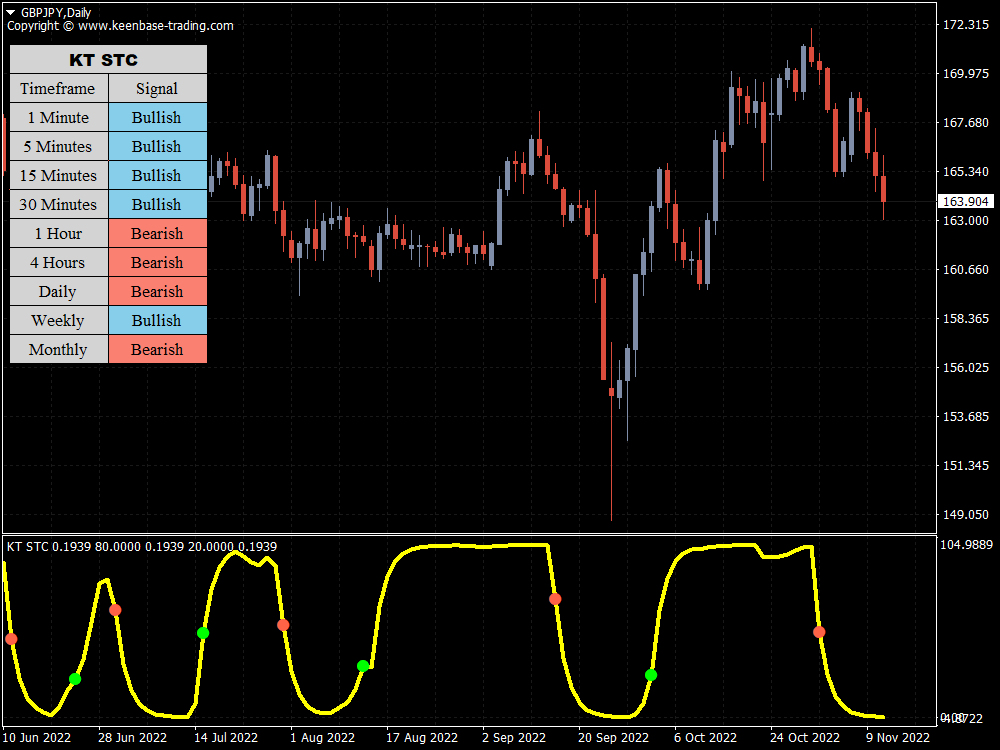
What Does the Schaff Trend Cycle Indicator Tell Traders?
Unlike some oscillator-based indicators notorious for lagging due to slow responsive signal lines, the STC indicator has a swift reaction time.
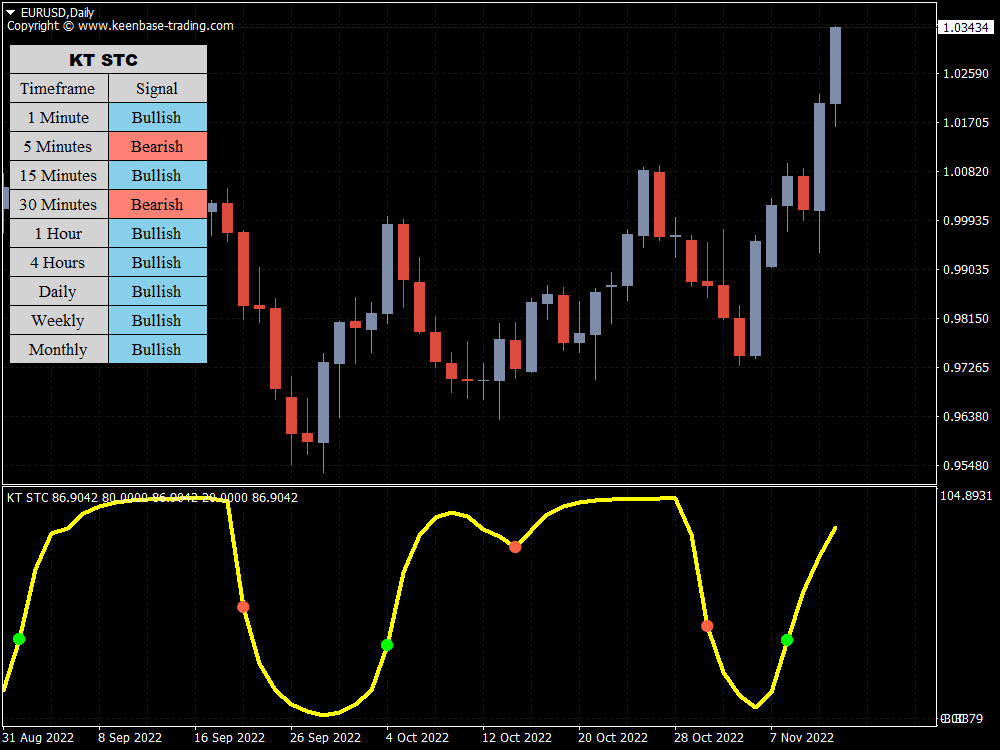
As a result, it is a good tool for traders to identify market trends, overbought or oversold trading conditions, buy or sell signals, and perfectly-timed trade entry and exit levels.
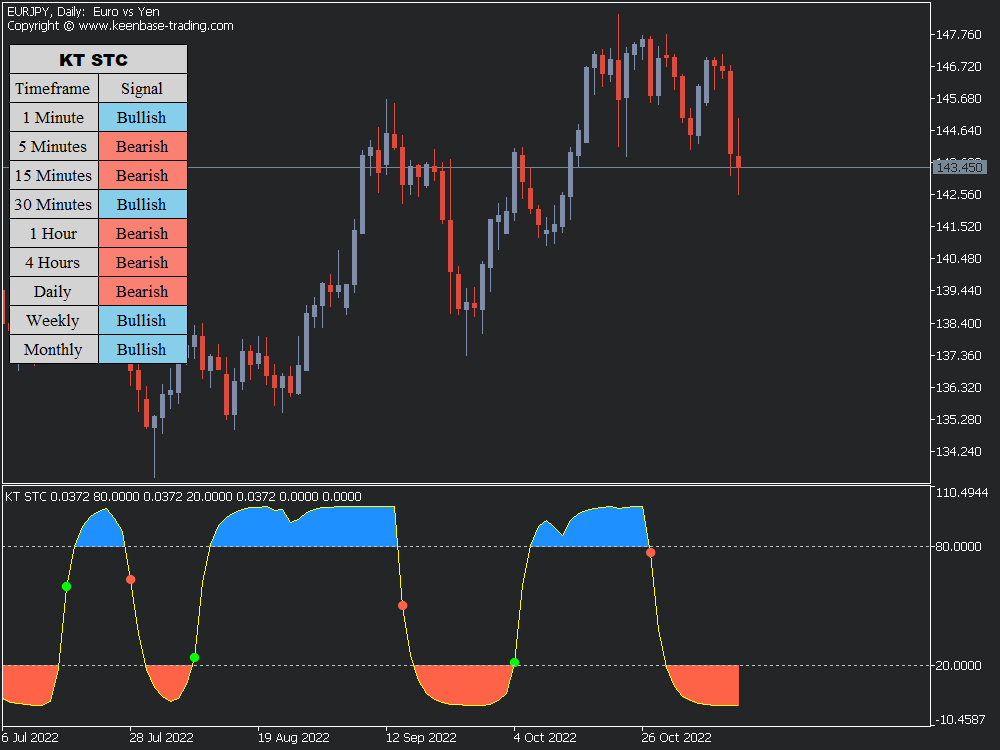
The Schaff Trend Cycle employs two technical points (thresholds), including 25 and 75. If the STC line crosses the 25-mark threshold, an uptrend in the market is confirmed.
However, if the Schaff and Trend Cycle indicator exceeds the 75-mark threshold, it generally indicates that the trend is strengthening in one of the two directions (up or down).
Furthermore, when the straight line of the STC rises above 75, it indicates that the market is in overbought conditions. Likewise, if the straight line falls below 25, it imeansoversold conditions.
Summary
Forex traders widely use the Schaff Trend Cycle. This is because it only works well in high-volume, liquid markets, such as currencies. However, the STC indicator is adaptable and can also be used in highly liquid equity markets.
Although it is a reliable and thorough indicator, traders will be better served using it with other indicators.
When combined with the data provided by other technical indicators, the Schaff Trend Cycle can be an influential contributing factor in developing an ideal trading strategy(EA).


