KT Day Trading Indicator MT4
- Description
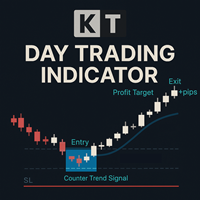
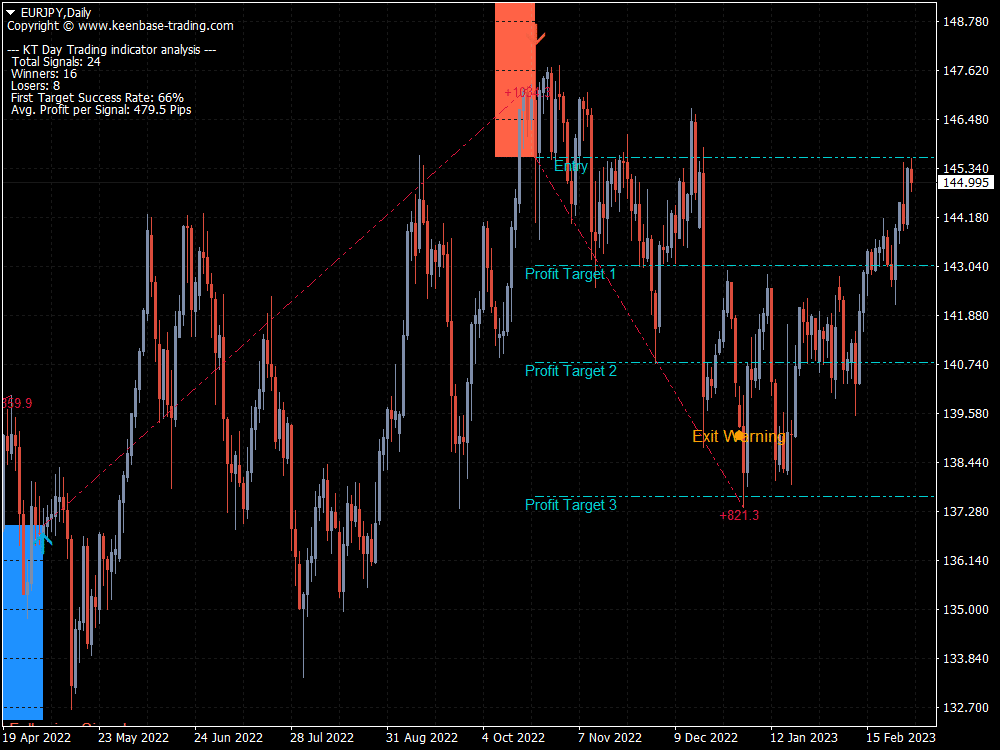
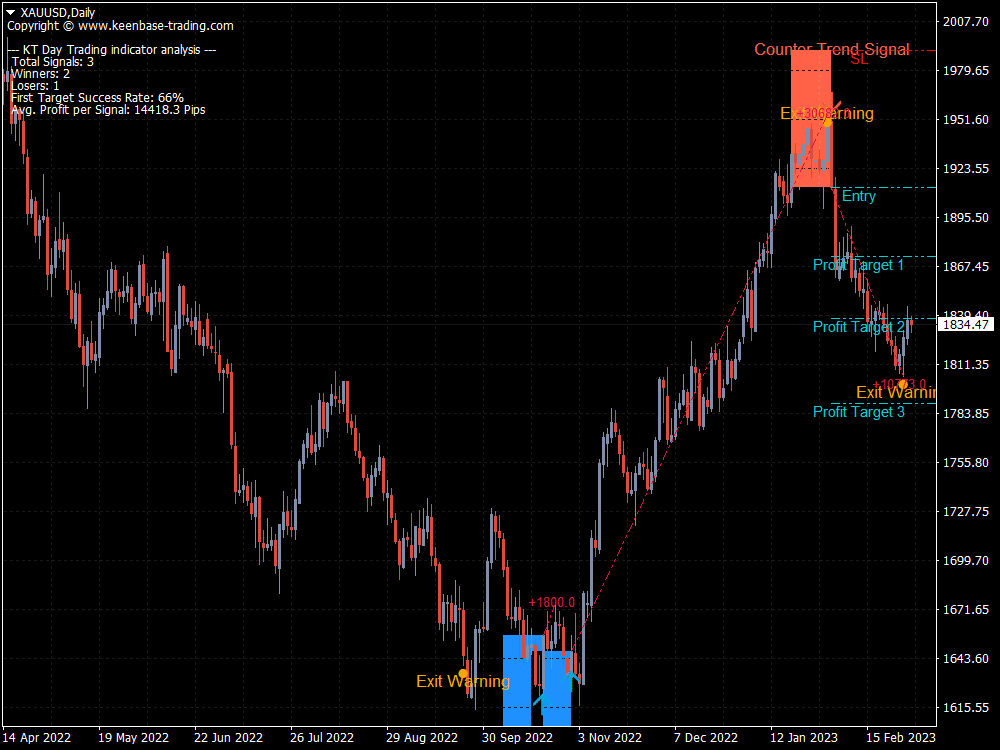
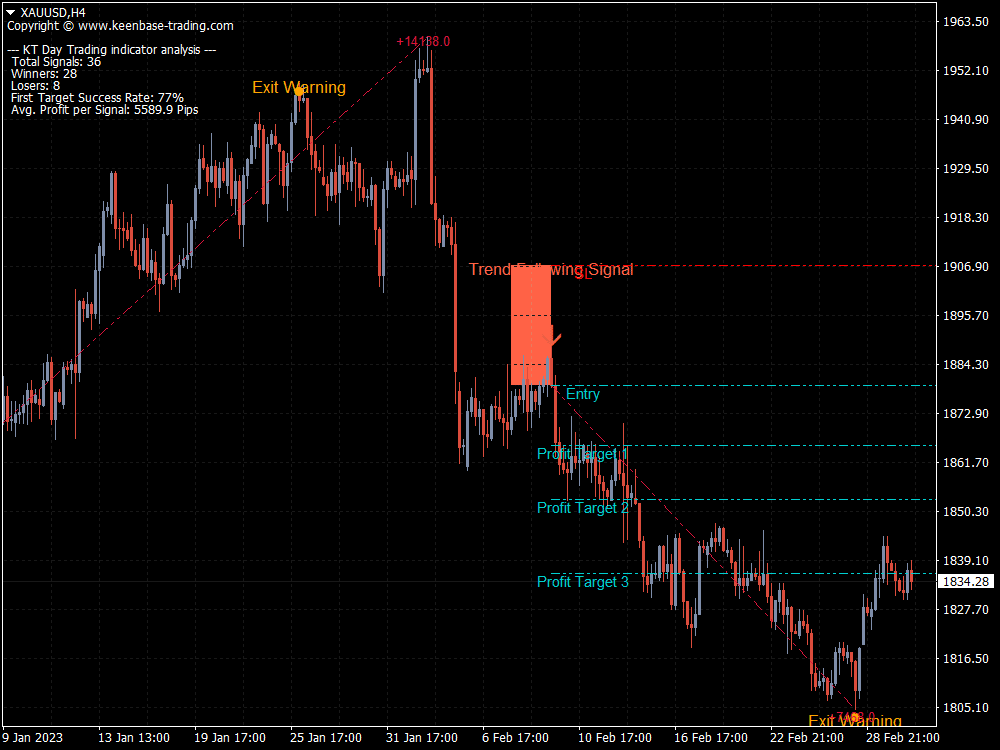
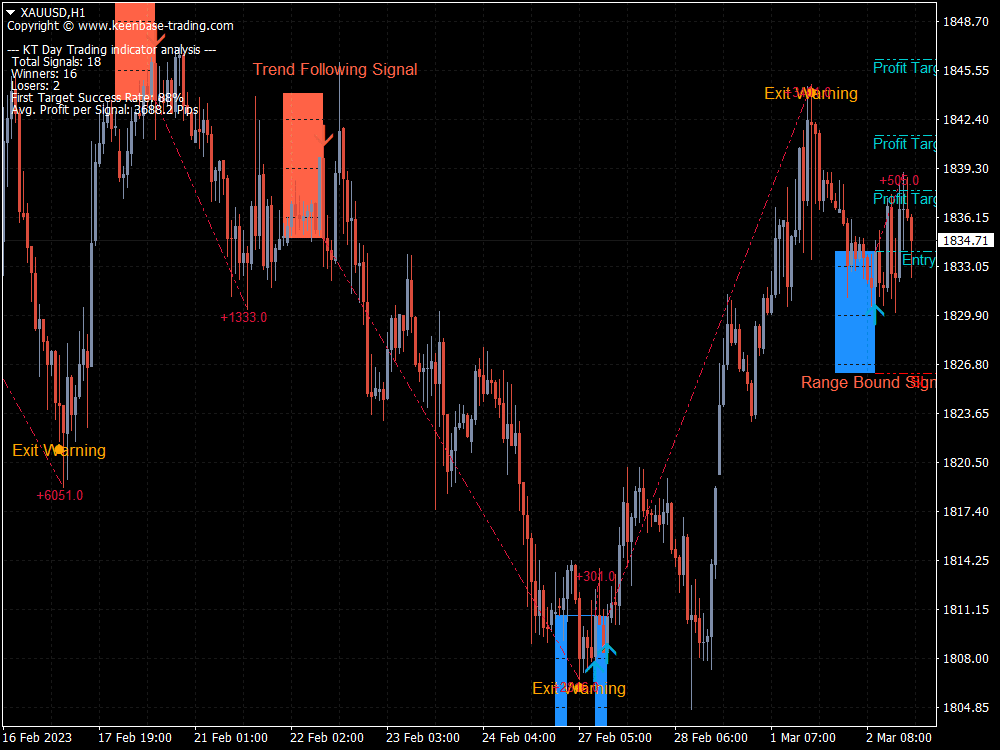
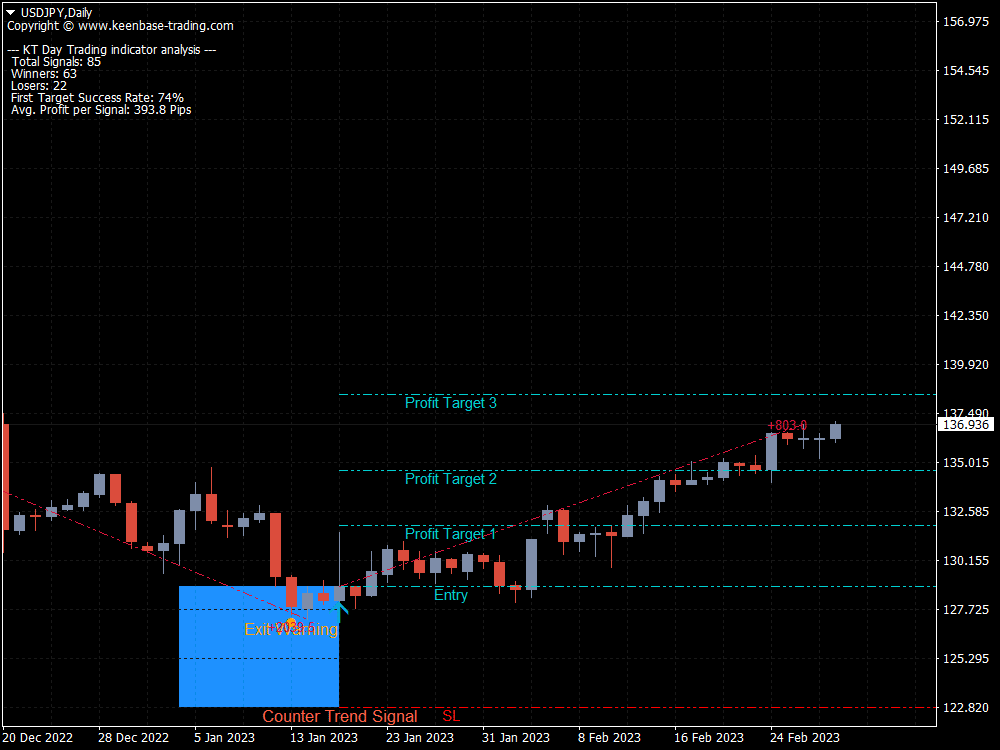
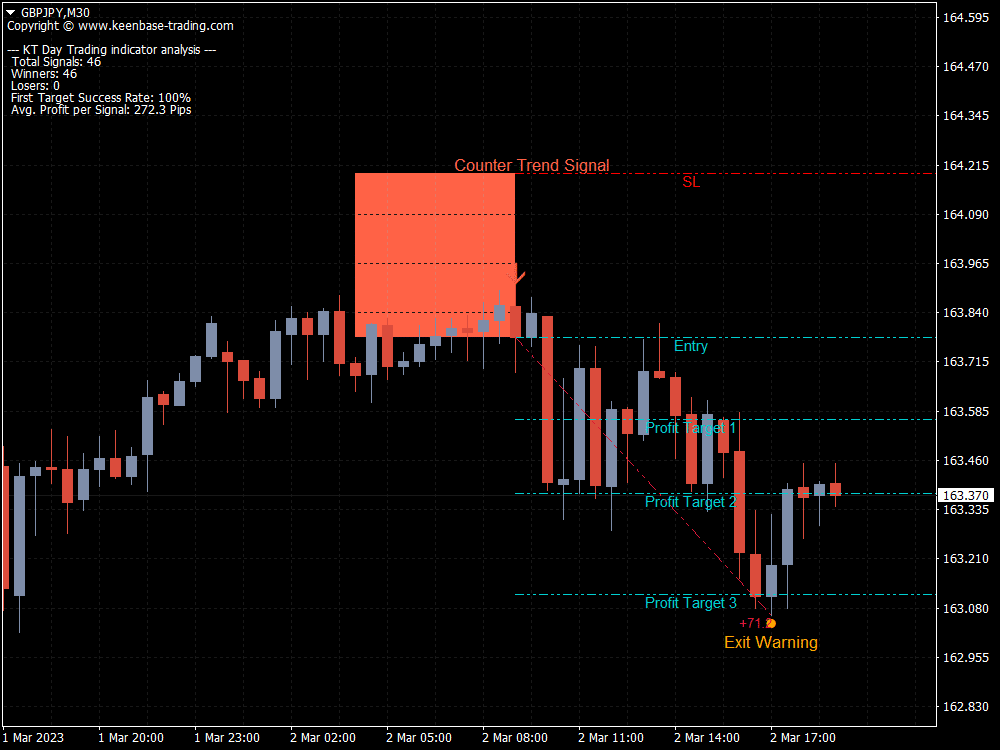
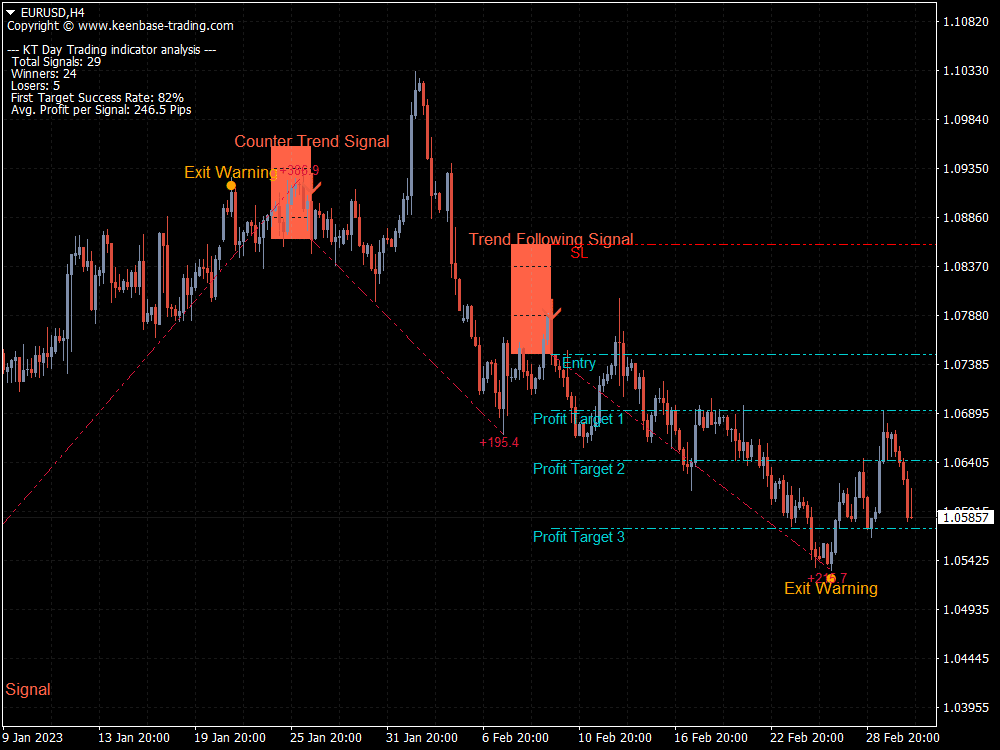
KT Day Trading indicator provides simplified Buy and Sell signals using a combination of some specific candlestick patterns occurring in the market exhaustion zones.
These signals are designed to identify market reversals and entry/exit points. The indicator can be used to trade on any timeframe from the 1 Minute up to the Daily chart.
Read More
Features
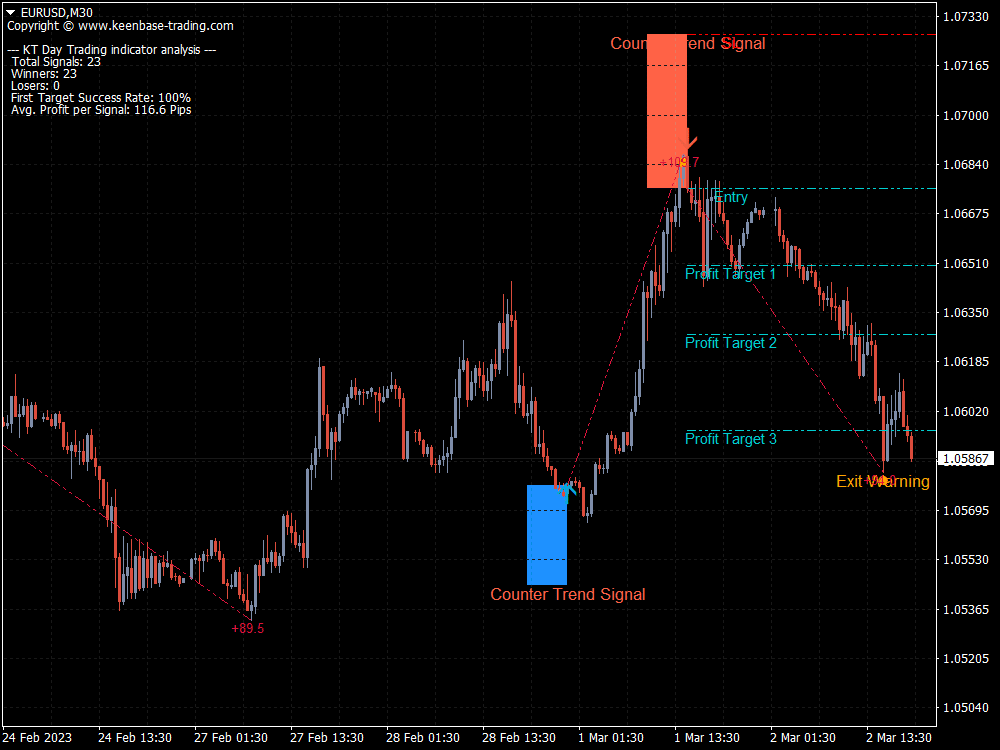
- Three types of entry signals according to the market structure i.e. Trend following, Range bound, and Counter trend signals.
- Crystal clear Entry, Stop-Loss, and Profit Targets are provided with each signal.
- An early exit signal is provided if market momentum turns the opposite after a signal.
- Performance analysis metrics such as Win/Loss, Success percentage, Avg. Profit etc.
- It is suitable for Day Traders, Swing Traders, and Scalpers.
- Consistent results across all the time frames.
!Pro Tip
To increase the success percentage on some pairs, you can turn off the Counter trend or Range bound signals.
Input Parameters
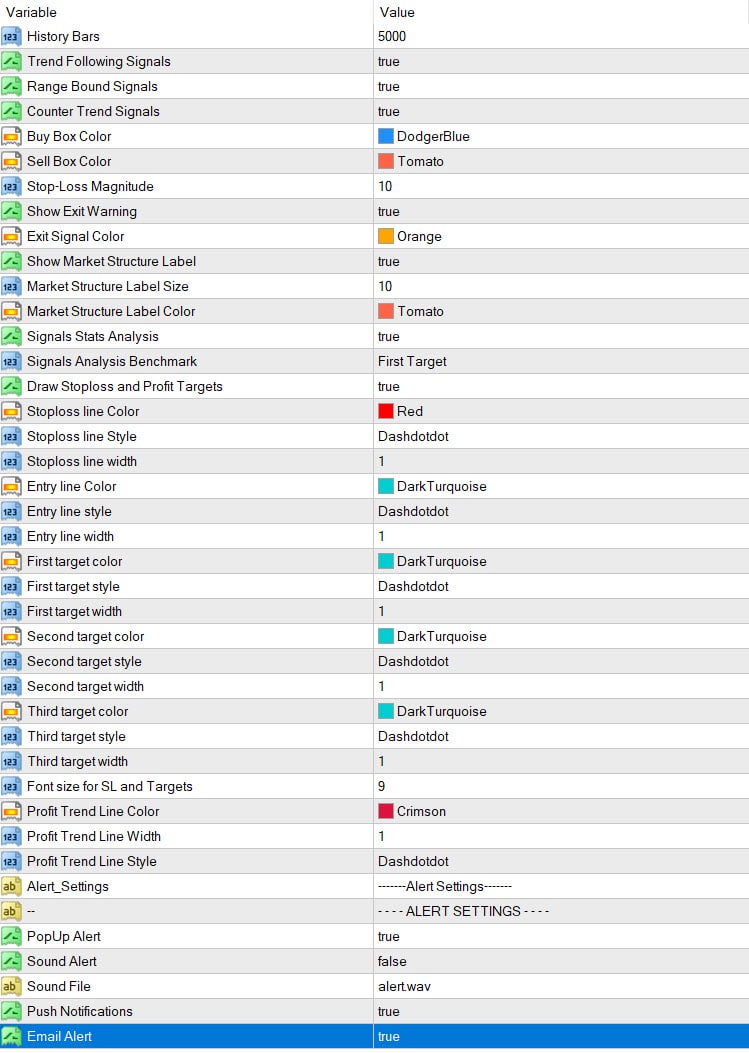
- Trend Following Signals: If true, the indicator shows the trend following signals in a trending market (For example, the Gold market during the London and New York session overlap).
- Range Bound Signals: If true, the indicator shows the range bound signals in a ranging market.
- Counter Trend Signals: If true, the indicator shows the counter-trend signals. These are the reversal signals opposite the main market trend.
- Stop-Loss Magnitude: Use this value to widen or tighten the stop-loss placement.
- Show Exit Warning: If true, the indicator will show an early exit warning signal if the market momentum turns the opposite.
- Show Market Structure Label: If true, the indicator will show the current market structure with each signal.
- Signal Stats Analysis: If true, the indicator will show the performance statistics of each signal.
- Signal Analysis Benchmark: Profit target benchmark to calculate the success percentage.
- Draw Stop Loss and Profit Targets: If true, the indicator will draw the stop loss, entry, and three profit targets.
- Indicator Alerts: If true, the indicator will send an alert every time a new signal appears.
Top Day Trading Indicator Strategies for Enhanced Market Profits
Some premier indicators for day trading are vital to achieving success in the market, with a particular focus on the indispensable “day trading indicator.” This resource is dedicated to pinpointing effective instruments that provide both transparency and optimal timing, which are crucial for those engaged in day trading.
It presents strategies on how traders can employ these indicators, particularly the critical day trading indicator, thereby refining their tactics and boosting profitability within the marketplace.
Key Takeaways
- KT Day trading indicator is an essential tool that filters market data, highlights trends, and generates buy or sell signals to guide traders’ decisions in the market.
- A variety of top indicators, such as Moving Average Convergence Divergence (MACD), Relative Strength Index (RSI), Bollinger Bands, and On-Balance-Volume (OBV), can significantly enhance a trader’s ability to evaluate trend direction, momentum, and potential trade entry and exit points.
- Combining different types of indicators and customizing their settings to fit individual trading styles can optimize trading strategies, with backtesting against historical data serving as a method for validation and refinement.
The Importance of Day Trading Indicators
Day trading indicators unlock a wealth of information hidden in market data. Derived from historical price data and predictive tools, these indicators are crucial in trading strategies and aiding decision-making.
Mathematical calculations transmute raw price data into more digestible and actionable information, simplifying the trader’s analysis process. Their ability to identify market trends and generate timely buy or sell signals is magic.
Understanding these indicators is vital, whether you’re a seasoned trader or a beginner in the day trading world. They offer insights into market trends, help generate trading signals, and ultimately guide trading decisions.
They are the eyes and ears of day traders, highlighting patterns and trends that might otherwise go unnoticed. They are the stepping stones towards profitable day trading.
Identifying Trends
When it comes to trading, knowledge is power. However, the sheer volume of market data can be overwhelming. This is where indicators come in, acting as a filter, sifting through the noise, and highlighting the crucial bits of information - the trends.
Some commonly used indicators include:
- Moving averages: They smooth out price data, indicating trends when they move upward or downward. Long-term moving averages like the 50-period and 200-period can provide a meaningful analysis of trends, as opposed to overly short periods like a 3-period average.
- Relative Strength Index (RSI): It measures the speed and change of price movements and helps identify overbought or oversold conditions.
- Bollinger Bands: They consist of a middle band (simple moving average) and two outer bands that are standard deviations from the middle band. They help identify volatility and potential price reversals.
These technical indicators can help traders make more informed decisions and improve their trading strategies.
Identifying trends goes beyond merely spotting an upward or downward movement. It involves seeing the bigger picture. Trade signals need to be considered within the larger market context, such as the overall trend of stock indices or the prevalence of stocks above a particular moving average.
This is where the Relative Strength Index (RSI) and the Average Directional Index come into play. During uptrends, RSI typically stays above 30 and often reaches 70 or more, while in downtrends, it generally holds below 70 and frequently drops to 30 or less, indicating potential support and resistance levels.
Generating Signals
Another pivotal role of day trading indicators is generating signals. Knowing when to enter and exit the market is critical to profitable trades. Indicators like the Moving Average and On-Balance-Volume (OBV) act as guidelines, pinpointing the best times to buy or sell.
Moving averages act as filters, and the KT Day Trading indicator works as a trigger, outlining the conditions for entering trades and the specific points at which action must be taken.
The OBV, the other hand, serves as a trend confirmation tool. Its divergence provides a warning of possible trend reversals. Then there are the Bollinger Bands, favored for generating numerous signals and clarifying price action patterns within market volatility.
When utilized effectively, these tools can act as a secret weapon in your trading arsenal, helping you decide when to enter or exit trades.
Top Day Trading Indicators to Boost Profitability
With an array of trading indicators, how do you know which ones are the most effective? This section delves into the top-day trading indicators that can significantly boost profitability. These indicators include:
- KT Day Trading indicator.
- Moving Average Convergence Divergence (MACD).
- Relative Strength Index (RSI).
- Bollinger Bands.
- On-Balance Volume (OBV)
Help traders determine trend direction, momentum, and potential entry and exit points.
These indicators are more than just popular; they are tried and tested tools of the trade. They are favored for their ability to measure current prices against historical price ranges to signal overbought or oversold conditions, assisting traders with entry and exit points.
They also provide a reference point for the average cost of an asset by incorporating both the price and volume data, aiding in making informed trading decisions.
Moving Average Convergence Divergence (MACD)
The Moving Average Convergence Divergence (MACD) is an indicator that oscillates and reflects short-term momentum and the direction of the trend based on its position to zero.
To compute the MACD line, one takes a 26-period Exponential Moving Average (EMA) and subtracts it from a 12-period EMA. Typically, there’s also a signal line, often represented by the 9-period moving average of this computed MACD line.
Trade signals given off by this tool occur whenever there’s an intersection between the MACD line and signal line, either upwards or downwards. This movement echoes price changes over time and aids traders in recognizing both momentum and trend orientation within markets.
Specifically, when we see that upward trajectory where our MACD crosses above its counterpart—the signal—this suggests a bullish sign. Conversely, what’s emitted is considered bearish evidence if it dives beneath said signal line.
Relative Strength Index (RSI)
Next is the Relative Strength Index (RSI), a momentum indicator designed to measure the magnitude of recent price changes and identify overbought or oversold conditions in a market. It signals overbought conditions above 70-80 and oversold conditions below 20-30, thus pinpointing potential entry and exit points.
The RSI settings can be adjusted according to your trading style. For instance, intraday traders may use settings of 9-11 for more sensitivity, while long-term traders might prefer 20-30 to filter out short-term fluctuations.
RSI is highly regarded for day trading due to its versatility in identifying entry and exit points and is particularly effective for options on individual stocks. Identified as the best technical indicator for spotting overbought and oversold conditions, RSI is integral for traders in pinpointing potential entry and exit points.
Bollinger Bands
Bollinger bands are another reliable tool in a day trader’s toolkit. They comprise a simple moving average with two lines representing standard deviations on either side. The bands measure the volatility of a market by widening during volatile periods and contracting when volatility is low.
Widening Bollinger Bands indicate higher volatility, and the standard deviation is used to measure the variability of historical prices. For effective day trading using Bollinger Bands, traders should adapt the indicator's settings to shorter periods and combine them with other indicators.
On-Balance Volume (OBV)
Last, we have the On-Balance-Volume (OBV), an indicator aggregating volume information into a single line, providing insight into cumulative buying and selling pressure. When the OBV line rises, it indicates increased buying pressure, which can signify that prices may continue to climb.
A divergence between the OBV line and price suggests that the current trend may lack strong support and could be nearing a reversal.
Traders primarily focus on the nature of OBV’s trends and changes over time rather than its absolute value when making trading decisions. It’s like a compass pointing towards the direction of the market wind, allowing traders to navigate the market currents efficiently.
Combining Indicators for Optimal Results
Though each indicator offers valuable insights individually, combining them unlocks their true potential. Just as a jigsaw puzzle’s image becomes apparent when all pieces are joined together, the market’s picture becomes more obvious when multiple indicators are combined.
This approach confirms trends, reduces false signals, and enhances decision-making in trading.
Combining different indicators, such as momentum and trend indicators, provides a well-rounded analysis and enhances decision-making. Selecting a balanced mix of hands from different categories helps avoid multicollinearity, ensuring each indicator contributes unique information.
Backtesting a strategy that utilizes a combination of indicators can quantify and validate trading rules against historical data.
Indicator Combinations
Combining indicators is like assembling a dream team, where each player brings a unique skill set. Using multiple indicators helps traders form comprehensive trading strategies rather than relying on a single indicator.
A common practice among traders is combining different indicators, such as a momentum indicator like RSI, with a trend indicator like ADX. Additionally, Bollinger Bands assesses market volatility.
Using RSI with Bollinger Bands in a range-bound market can help identify potential turning points. Confirming trading signals using indicators from different categories (e.g., momentum and trend) helps reinforce the validity of these signals and better adapts to market dynamics.
Customizing Settings
Trading indicators arrive with default settings, but tailoring them to align with your trading objectives and preferences can boost their effectiveness. For instance, you can adjust your RSI's settings to match your noise tolerance in the data and tailor the indicator’s sensitivity.
However, constant changes to the indicator settings can be detrimental. Focusing on effectively learning to use the indicator is crucial instead of seeking perfect locations.
In a trading plan, incorporating user-defined settings is essential to adapt indicators such as modifying the look-back period to align with one’s specific trading preferences.
Technical Analysis vs. Fundamental Analysis
In the world of trading, there’s a constant debate between two schools of thought: Technical Analysis and Fundamental Analysis. While they both aim to predict future price movements, they approach the task from different angles.
Technical analysis involves reading market sentiment by interpreting chart patterns and signals, while fundamental analysis evaluates a security’s intrinsic value by examining economic and financial factors.
Both methods boast advantages, but it’s essential to realize that there’s no definitive conclusion on which way is more effective. It’s like asking whether a screwdriver is better than a hammer. The answer depends on the task at hand. Both tools are essential in a trader’s toolbox, and their effective use depends on the user's skills.
Technical Analysis Advantages
Technical analysis offers several advantages to traders. It simplifies decision-making by providing visual charts that make identifying trends and recognizing patterns easier. The tools for conducting technical research are widely accessible and often available at little or no cost, making them available to a broad range of traders.
Technical analysis is governed by objective rules, giving traders a clear set of risk management guidelines. Moreover, the principles of technical analysis can be applied to multiple financial markets, including:
- Stocks
- Forex
- Commodities
- Cryptocurrencies
It can also be applied over different periods and geographic regions.
Fundamental Analysis Advantages
On the other hand, fundamental analysis offers a comprehensive view of a security’s long-term potential. It includes factors such as:
- Overall economy conditions
- Industry trends
- Effectiveness of company management
- Financial performance
These factors are crucial for understanding an investment’s long-term potential.
Fundamental analysis is versatile and not limited to specific types of securities; it can be applied to stocks, bonds, and derivatives. Fundamental analysis emphasizes Corporate governance and management quality, as they can significantly impact a company’s success and stock performance.
Financial statements are a cornerstone in fundamental analysis, providing quantifiable data that investors can analyze to judge a company’s financial health and make well-informed investment decisions.
Implementing Day Trading Indicators in Your Trading Plan
Including day trading indicators in your trading plan equals embedding a GPS in your vehicle. It doesn’t just show you the way; it helps you avoid traffic, find the quickest route, and even locate nearby amenities. In trading terms, this means defining objective rules, using multiple indicators, and adapting to market conditions.
A comprehensive trading strategy should include:
- Exact conditions for entry, exit, and trade management.
- Multiple indicators to establish these rules.
- Filters and triggers based on indicators.
- Filters to set up the conditions for considering a trade.
- Triggers to define the precise moment to execute the trade.
Developing a Trading Plan
Drawing up a trading plan is similar to creating a roadmap. It should reflect a trader’s:
- Motivation
- Available time for trading
- Goals
- Attitude towards risk
- Available capital
- Personal risk management rules
Risk management is a critical aspect of a trading plan; traders should only use the capital they can afford to lose and implement stop orders to limit potential losses.
A part of a trading plan should include a regular review and adjustment process based on strategy performance, market insights, and how well the plan’s guidelines are being followed.
Record-keeping through a trading diary allows traders to document trades, including technical details and decision rationale, to facilitate learning from experience. Backtesting strategies against historical data is crucial for developing and refining profitable trading strategies, forming part of the ongoing strategy evaluation.
Adapting to Market Conditions
Markets are ever-changing, dynamic entities influenced by a myriad of factors. For traders, adapting to these changes is a critical success factor.
This involves modifying trading plans and indicator settings or switching to different indicators to match the ever-changing market environment and ensure sustained strategy effectiveness.
By monitoring ongoing trade performance and undertaking a regular review of trading outcomes, traders can:
- Pinpoint prevailing characteristics in losses and gains.
- Fine-tune their approaches on the fly.
- Ensure their strategies are updated to align with the current market scenario.
This allows traders to continuously improve their trading strategies and adapt to changing market conditions.
Summary
In the world of day trading, indicators are the compass that guides traders through the unpredictable waves of the markets. They transform complex market data into actionable insights, helping traders identify trends, generate signals, and make informed trading decisions.
The top day trading indicators, including the MACD, RSI, Bollinger Bands, and OBV, provide a comprehensive view of the market, assisting traders in their quest for profitability.
The true power of these indicators, however, lies in their combination. By combining different indicators and customizing their settings, traders can achieve optimal results, confirming trends, reducing false signals, and enhancing decision-making.
Whether you’re a seasoned trader or a beginner, understanding these indicators and implementing them in your trading plan is critical to navigating the ever-changing tides of the market and achieving success in your trading journey.
Frequently Asked Questions
What is the best MT4 indicator for day trading?
Day trading often relies on technical indicators to make informed decisions, and among the top MT4 indicators valued for their accuracy in providing signals are the Moving Average (MA), Relative Strength Index (RSI), Bollinger Bands, and Moving Average Convergence Divergence (MACD).
These tools are essential for traders requiring precise assistance in determining their trading moves.
What is the most accurate day trading strategy?
Trend trading stands out as the most precise strategy for day trading, where traders employ technical analysis to pinpoint trades that align with an established trend direction, constituting one of the markets’ most reliable methods.
What chart signals to look out for day trading?
Keep an eye out for the flag and pennant patterns, as these continuation configurations are among the most popular with day traders and provide robust trading signals.
Do indicators work in day trading?
Indicators can work in day trading by providing valuable buy and sell signals. Still, it’s essential not to use too many indicators to avoid confusion and focus on the ones that best fit your strategy.
How can combining multiple indicators enhance trading results?
Combining multiple indicators enhances trading results by providing well-rounded analysis, confirming trends, reducing false signals, and aiding in informed decision-making. This can lead to more effective trading strategies.
Screenshots

You Might Also Like
Help others make better choices. Please review your recent purchase.
By sharing your review, you will help others to make advised decision about what they buy from us. Thanks for contributing.
You must log in to submit a review.

