Whether you're a beginner or an experienced trader, this tool offers an enhanced understanding of trend dynamics, leading to improved trading strategies on your trading platform.
The capability to concurrently monitor multiple timeframes offers a more comprehensive view of the market, helping traders identify dominant trends, potential reversal points, and optimal entry or exit points.
Whether you're a day trader or a long-term investor, this tool is a valuable asset for making well-informed and strategic trading decisions when trading Forex currency pairs.
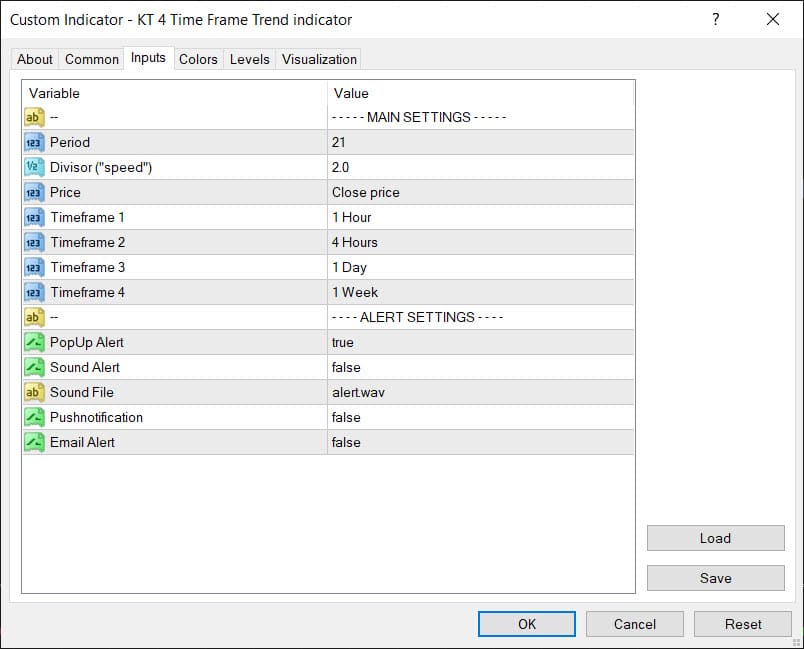
Inputs
Features
Multiple Time Frame Analysis
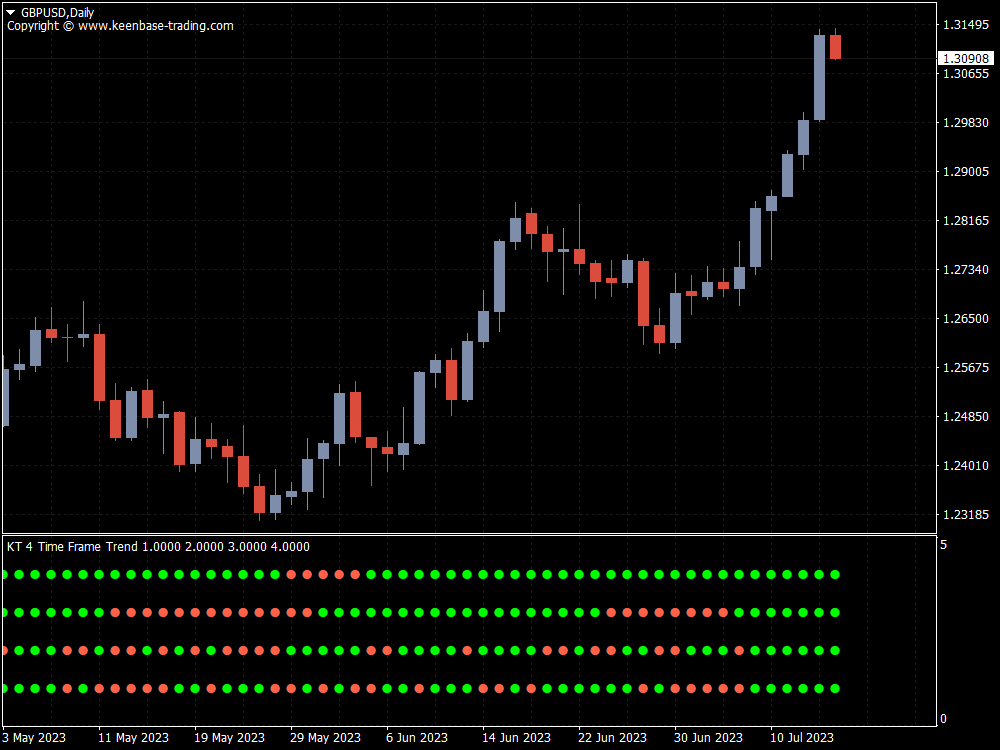
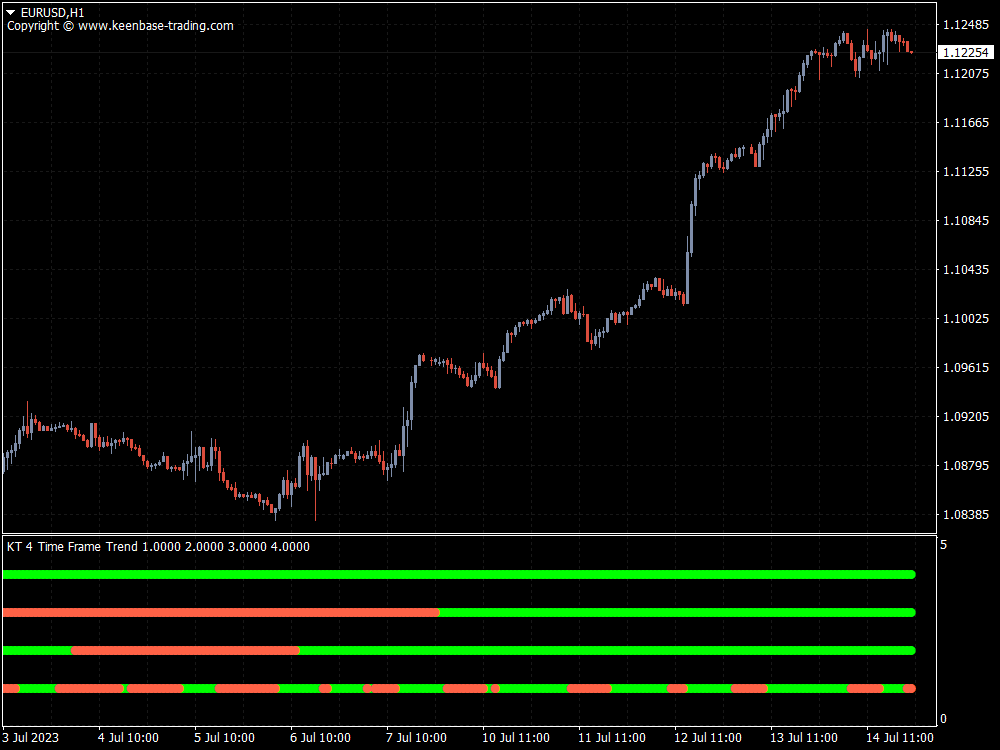
The main feature of this Forex indicator is its ability to analyze and display trends from four different time frames simultaneously.
This comprehensive view lets you understand the broader market context, from long-term trends to short-term fluctuations.
Customizable Time Frames
Depending on your trading strategy and preferences, you can choose which four different time frames you wish to view.
For example, a day trader might view 15-minute, 1-hour, 4-hour, and daily trends, while a longer-term trader might select daily, weekly, and monthly timeframes.
Colour-Coded Trend Visualization
The indicator typically uses colour coding to represent different trend directions, making it easy to understand the prevailing trends across the selected time frames visually.
Alerts and Notifications
The KT 4 Time Frame indicator comes with multiple alert functions.
This means the system can notify you when there's a change in trend direction in any of the monitored time frames.
Pro-Tips to Use 4 Time Frame Trend Indicators
Alignment of Trends
The strongest trading signals occur when all the time frames indicate the same trend.
This alignment of trends across multiple time frames increases the probability of the trend continuing.
Trade in the direction of the Higher Time Frames
Always consider the trend direction of the higher time frames.
They carry more weight as they include more data.
If you're trading on a 15-minute chart, but the 4-hour and daily charts are bearish, looking for a sell signal or other short opportunities might be better.
4 Time Frame Hull Trading
KT 4 Time Frame Trend indicator facilitates comprehensive 'Timeframe Hull Trend' analysis.
This functionality allows you to apply the Hull Moving Average (HMA) - renowned for reducing lag and enhancing smoothness - concurrently across four different time frames.
With this, you gain a more detailed understanding of market dynamics by examining trends through multiple lenses.
The 'Hull Trend' method helps identify the prevailing market trends, potential reversals, and strategic entry or exit points.
Experience the practicality of performing '4 Time Frame Hull Trend analysis' using our '4 Time Frame Trend Indicator,' and streamline your trading approach.
Adjust Time Frames Based on Your Trading Style
Customize the time frames according to your trading style. For instance, if you're into day trading, you might set your indicator to 15-minutes, 1-hour, 4-hour, and 1-day charts.
Conversely, if you're into Swing trading, you might select daily, weekly, and monthly timeframes.
Top Pairable Indicators For KT 4 Time Frame Indicator
The 4 Time Frame Trend Indicator is a trend-following tool.
So it is recommended to combine these signals with other credible indicators like those below to avoid false signals.
