We hope you enjoy reading this blog post.
Become a Pro Trader by using our fine-tuned Indicators and Expert Advisors.
Trading with Volume Indicators: Top 7 Strategies for Forex Market Analysis

Most traders in the world have two scarce components: price action and volume. These twin pillars form the foundation of nearly every trading strategy, charting tool, and technical analysis method.
Whether you’re using an indicator, a pattern recognition system, or even drawing tools, they all rely on understanding these two elements.
While price action is visible on every chart, interpreting and studying volume is a different story. Making quick, objective decisions purely from price and volume alone is challenging – and that’s where the role of indicators becomes crucial for your trading success.
What are Volume Indicators?
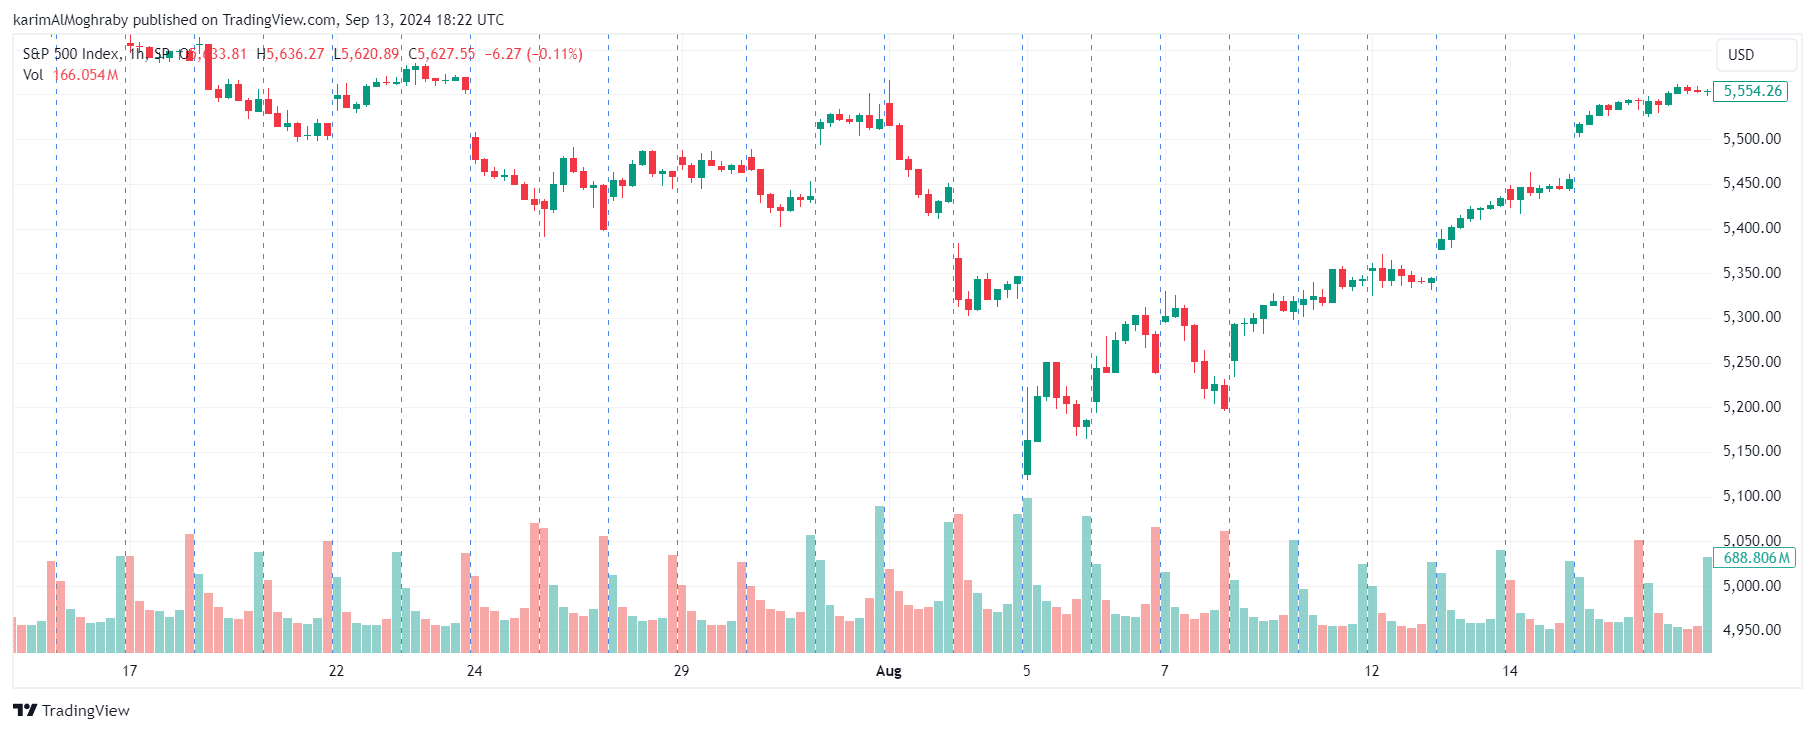
Volume indicators in technical analysis measure the buying and selling pressure of a currency pair, reflecting the balance between supply and demand. They help traders gauge whether the bulls or bears are driving current price movements. Simply put, volume represents the total number of traded lots within a given time frame.
When volume indicators show high activity, it suggests that there is a noticeable increase in supply or demand on the underlying asset, some traders use volume fluctuations to set an entry or exit from the market.
If a currency pair trends upward or downward with rising volume, it signals the continuation of that trend. However, if the trend is accompanied by declining volume, it suggests a potential market reversal, as the weakening trend may soon reverse direction.
Why Volume is Important in Trading
The price of an asset reveals how the market values it, but the trading volume uncovers the real strength behind that price movement. For example, imagine a stock climbing from $40 to $48 (a 20% increase)—on the surface, this appears significant.
But if trading volume is low, this price change might lack the conviction necessary to sustain itself. Without substantial volume, price shifts may be fleeting.
While terms like "momentum" or "weight" aren’t literal, they serve as effective metaphors for how assets behave in the market. For instance, if a stock’s price drops with heavy volume, it signals strong selling pressure from the bears, driving the price down with force.
Think of it like pushing a swing—giving it a small nudge will make it move briefly, but a powerful push will send it soaring for longer. Similarly, the more "force" (or volume) behind a price movement, the greater the impact and duration—until that push begins to lose strength.
How does volume benefit short-term traders?
1. Confirmation of Trends
Volume indicators help traders determine how solid a trend is and when it might reverse, offering key entry and exit points. If a stock is climbing with rising volume, it signals strong buying interest, backing the uptrend.
But if prices are rising and volume is shrinking, it could suggest that the uptrend is losing steam, which could hint at a possible reversal.
2. Identification of Reversals
Volume spikes can signal potential reversals, even before the price changes direction. To elaborate, if a currency pair falls from 1.2000 to 1.1800 on high volume, this could indicate panic selling.
Once selling pressure exhausts, the price may stabilize or even reverse direction, providing traders with opportunities to capitalize on the change.
3. Validation of Breakouts
When prices break out of established ranges, volume is a key factor in validating the move. If a stock breaks above a certain resistance level with a sharp increase in volume, it signals that many traders are backing the breakout and a lot of capital inflow is happening, increasing its likelihood of success.
Without that volume spike, the breakout may be false, and the price could quickly fall back into the previous range, liquidating some traders out of the market.
4. Liquidity Insights
For short-term traders, liquidity is vital. Volume acts as the clear face indicator of liquidity—higher volume suggests easier entry and exit points at desirable prices. A high-volume day for a stock that typically trades lightly ensures more flexibility for short-term traders looking to buy or sell quickly.
5. Market Sentiment
The volume also reveals market sentiment. High volume during price increases often points to bullish sentiment, while high volume during price declines suggests bearish sentiment.
Recognizing this connection between volume and market sentiment enables traders to better anticipate future movements. For example, high volume during a price drop might indicate strong bearish sentiment, but if volume begins to taper off, it could signal that the downward momentum is weakening.
By understanding volume as more than just numbers, traders can gain insight into the underlying motive that is pushing the price in a certain direction, acting as the justifier for price actions and movements.
The Magical 6 Volume Indicators
Before explaining each volume indicator in depth, keep in mind that each offers a unique lens or perspective through which you can assess market strength, trends, and potential turning points. Make sure to choose the indicator that fits your strategy the best.
1. VWAP – Volume-Weighted Average Price
The Volume Weighted Average Price (VWAP) is a popular intraday technical indicator that combines both price and volume to give a more comprehensive view of an asset's trading activity.
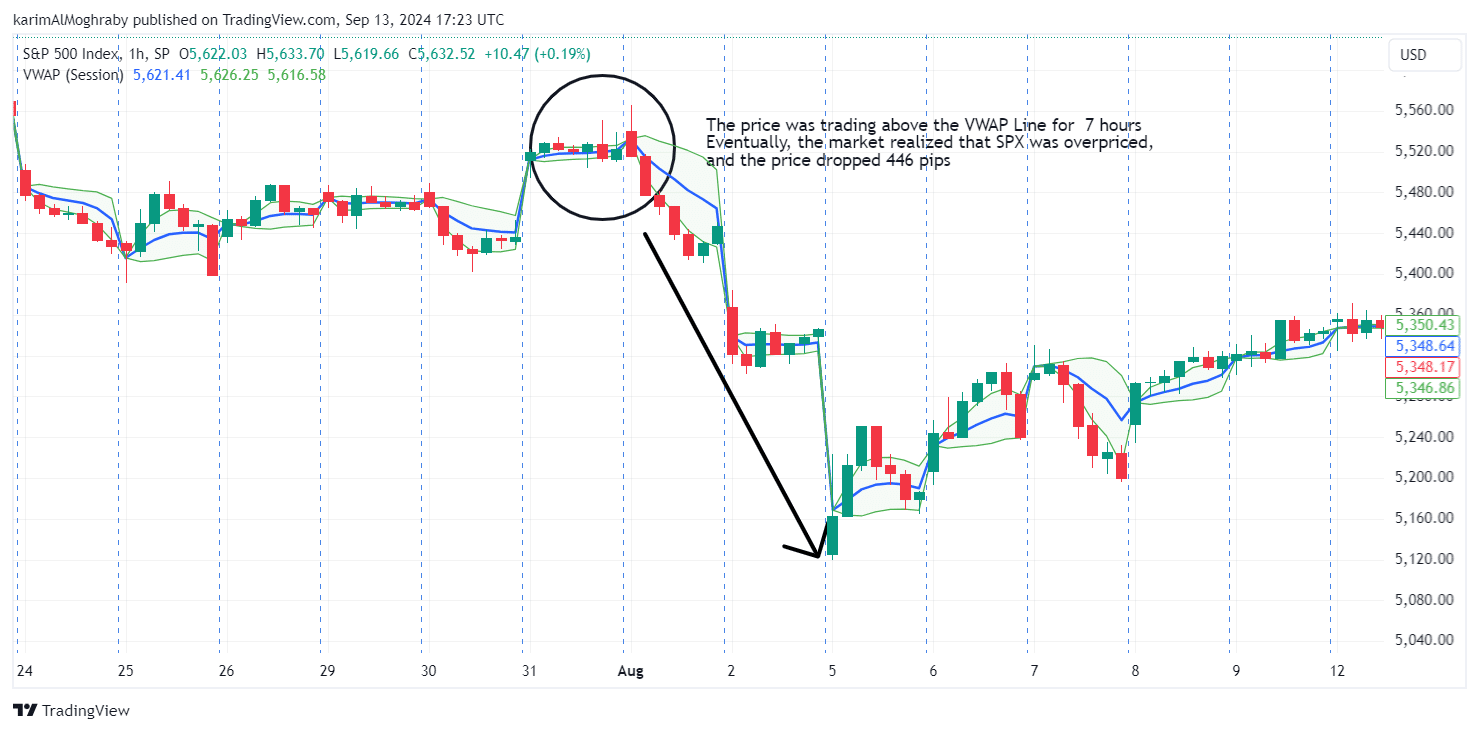
Unlike simple price averages, VWAP weighs price movements based on trading volume, providing a clearer representation of the average price paid for an asset throughout the day.
VWAP Calculation
VWAP is calculated by multiplying the price of an asset by its trading volume for each period and then dividing the cumulative total by the sum of the volumes.
This produces a volume-weighted price that reflects the actual trading activity, offering traders a more accurate view of the asset’s average price over a specific trading session.
Formula: VWAP= ∑(Price x volume)/∑(volume)
- Price = (High + Low + Close) / 3 (Typical price for the period)
- Volume = Total volume traded for each period
- ∑ (Price × Volume) = Sum of price multiplied by volume for each period
- ∑ Volume = Sum of total volume over the period
Importance of VVAP in Trading
VWAP is especially useful for identifying whether an asset is trading at a fair price during the day. If the price is above the VWAP line, the asset may be overvalued, signaling potential selling opportunities.
Conversely, if the price is below the VWAP, it may be undervalued, making it attractive for buying at a lower risk of being a false signal.
VWAP is also frequently used to confirm breakouts and reversals, as well as to identify support and resistance levels. Institutional traders often use VWAP to minimize their market impact and get out of the grey market manipulation zone by buying below or selling above the VWAP.
2. Volume-Weighted Moving Average (VWMA)
The Volume Weighted Moving Average (VWMA) is a technical indicator that utilizes the traditional moving average by incorporating trading volume, considering more weight to price movements during periods of higher activity.
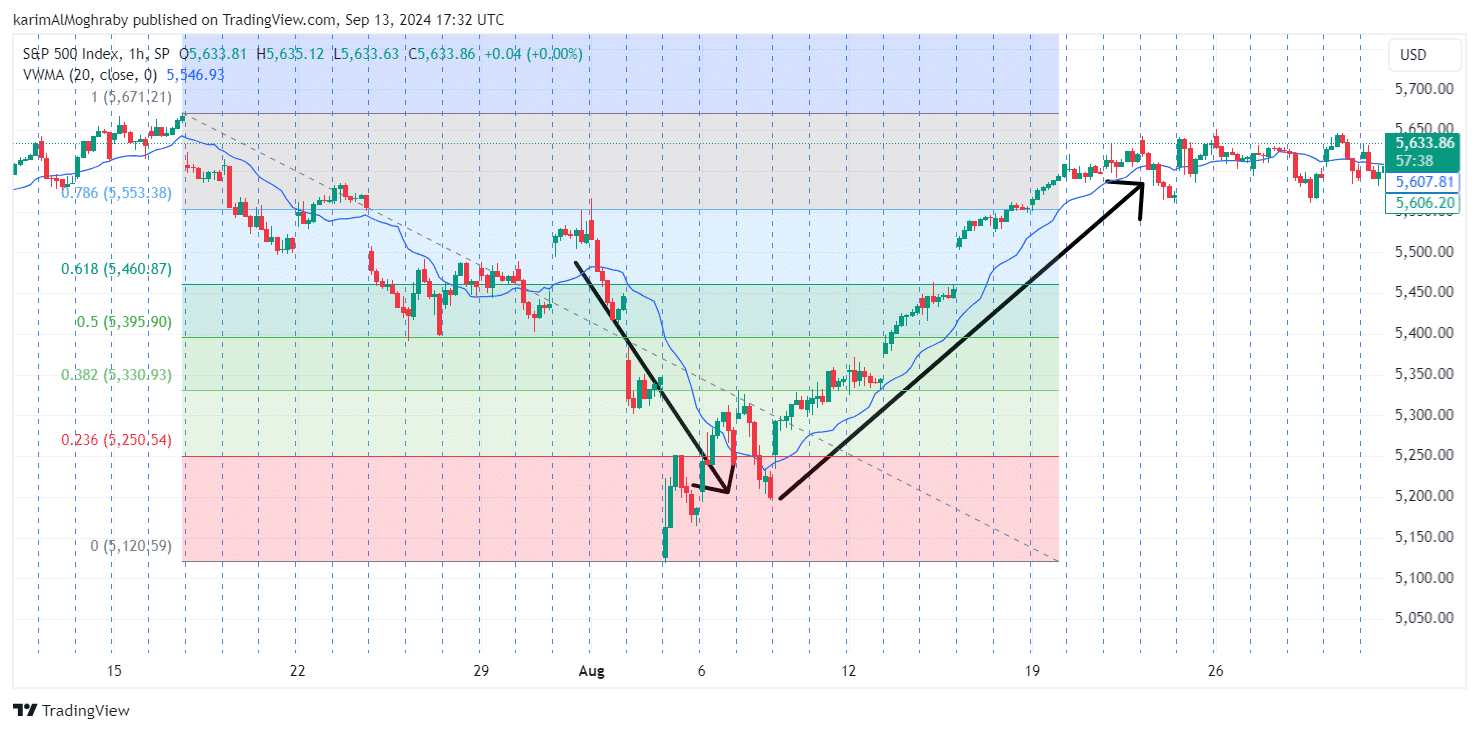
Unlike the Simple Moving Average (SMA), which treats each price point equally, VWMA emphasizes times with higher trading volume, providing a clearer picture of market sentiment.
VWMA Calculation
VWMA is calculated by multiplying the price by the volume for each period and then dividing the total by the sum of the volumes. This results in a weighted average that reflects both price and trading activity, offering a more accurate sense of an asset’s value compared to the SMA.
Formula: VWAP= ∑(Price x volume)/ ∑(volume)
- Price = Closing price of the asset for each period.
- Volume = Total volume traded for each period.
- ∑ (Price × Volume) = Sum of price multiplied by volume over the desired period.
- ∑ Volume = Sum of total volume over the selected period.
Importance of VWAP in Trading
VWMA is mostly useful for identifying trends, reversals, and support/resistance levels. An upward-sloping VWMA suggests a bullish trend, while a downward-sloping VWMA indicates bearish momentum.
Traders use VWMA to spot crossovers—when the price crosses above VWMA, it signals a potential upward trend, and when the price falls below it, a downward trend may continue.
Incorporating volume into the analysis helps traders make more informed decisions, offering insight into trend strength and possible turning points.
3. Money Flow Index (MFI)
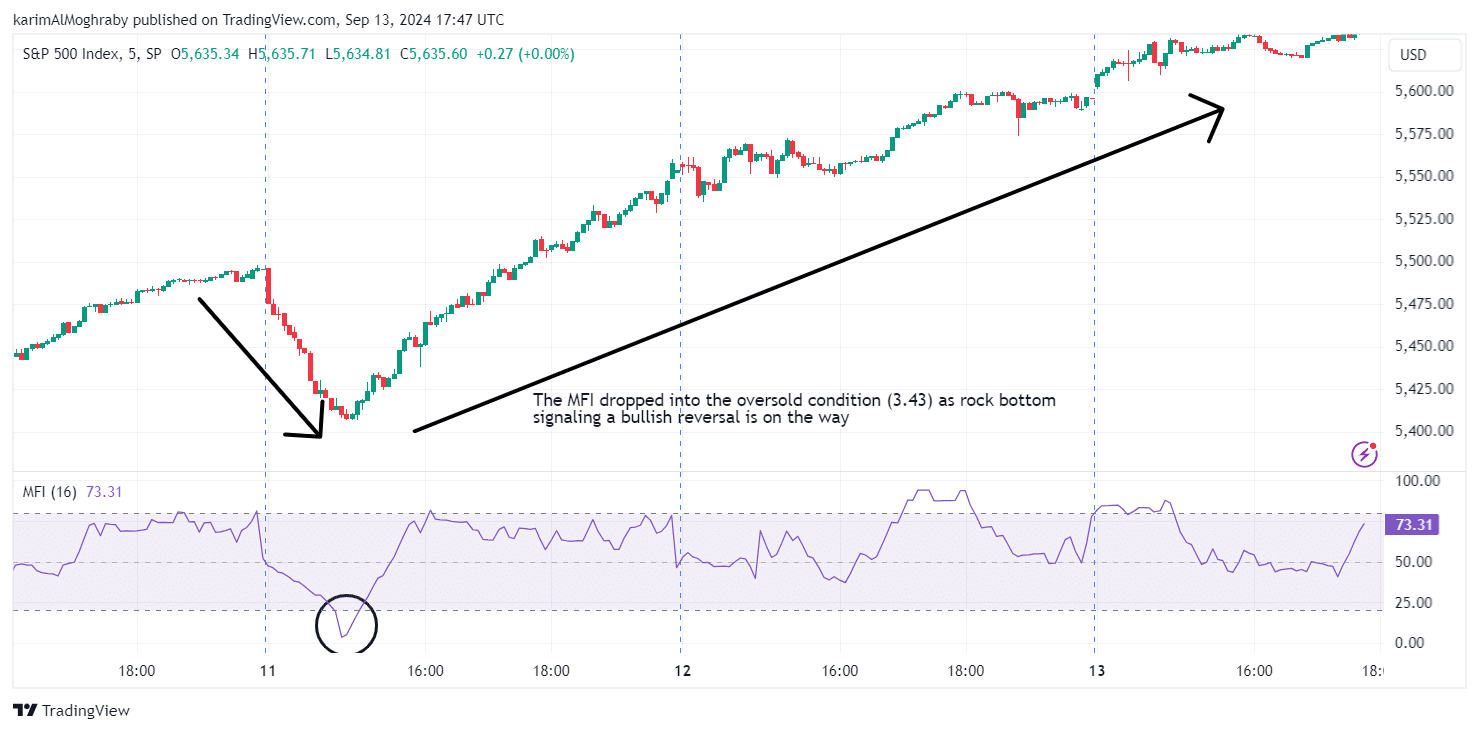
The Money Flow Index (MFI) is an indicator that combines price and volume to identify overbought and oversold market conditions. Often called the "volume-weighted RSI," the MFI operates similarly to the Relative Strength Index (RSI) but includes trading volume in its calculation formula, exposing traders to additional insights into market momentum.
MFI Calculation
The MFI is calculated in a few steps:
- Typical Price: This is the average of the high, low, and close prices, calculated as:
Typical Price = (High + Low + Close) / 3 - Raw Money Flow: The typical price is then multiplied by the volume to get the raw money flow:
Raw Money Flow = Typical Price × Volume - Money Flow Ratio: The sum of positive money flows (from periods where the price rose) is divided by the sum of negative money flows (from periods where the price fell) over a set period, typically 14 days.
- MFI Formula: MFI = 100 - (100 / (1 + Money Flow Ratio))
Importance of MFI in Trading
MFI is useful for spotting potential trend reversals. When the indicator hits overbought levels (above 80), it suggests that the asset may be overvalued, and a downward reversal could be imminent. Conversely, when MFI falls below 20, the market may be oversold, presenting a potential buying opportunity.
Additionally, MFI can confirm trends and uncover divergences. If the price rises but MFI falls, it could signal weakening momentum, hinting at an upcoming trend reversal.
Using MFI alongside other indicators or chart patterns can help traders make more informed decisions, reduce risk, and improve the timing of their trades.
4. Accumulation and distribution indicator (A/D)
The Accumulation/Distribution (A/D) Indicator is a volume-based tool designed to assess whether an asset is being accumulated (bought) or distributed (sold).
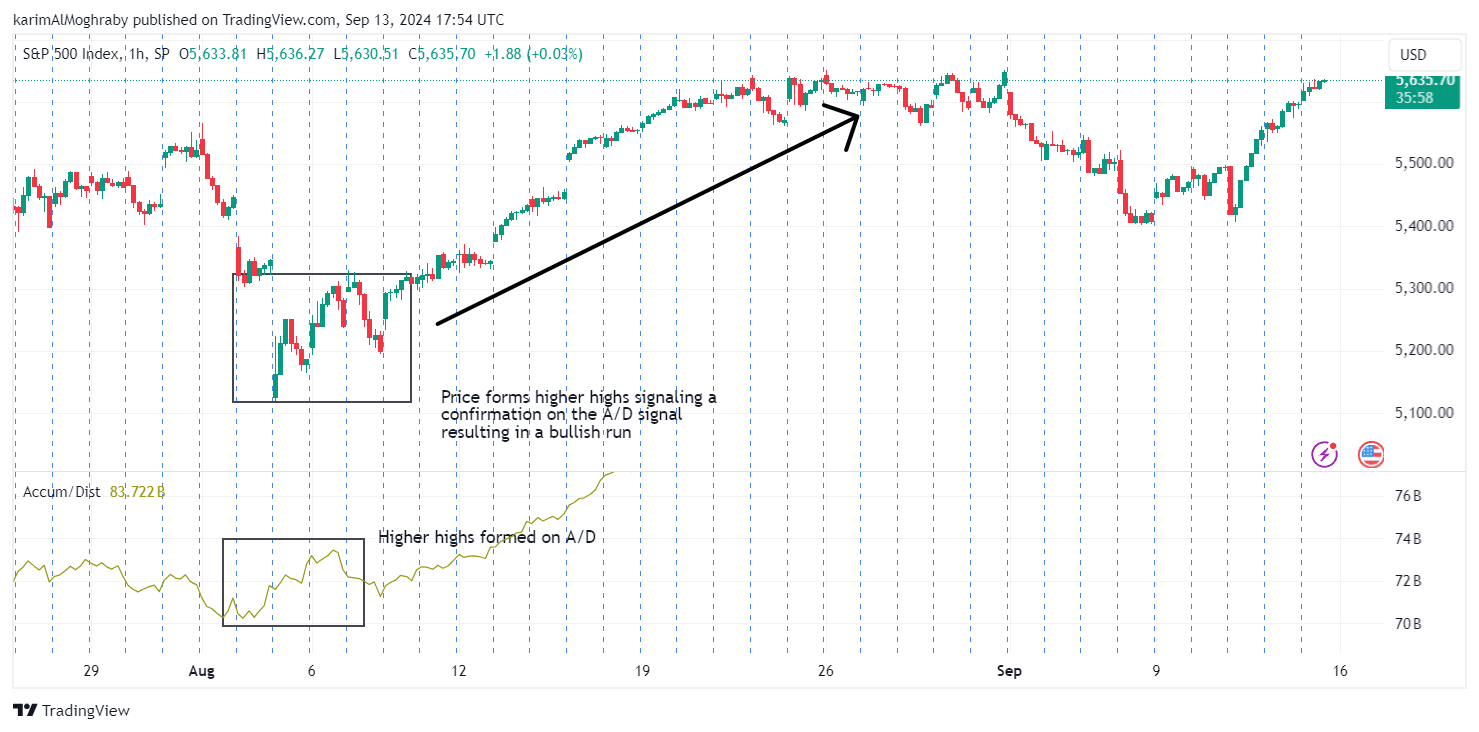
Analyzing price and volume data, helps traders determine the balance between supply and demand, which can provide a forecast of potential future price movements. It combines the asset's price with its trading volume to measure buying and selling pressure.
Calculation of A/D Indicator
The A/D calculation involves three key components:
- Money Flow Multiplier: This is used to assess where the close price is relative to the high and low prices of the period.
Money Flow Multiplier = [(Close - Low) - (High - Close)] / (High - Low) - Money Flow Volume (MFV): The Money Flow Multiplier is then multiplied by the volume to get the Money Flow Volume: MFV = Money Flow Multiplier × Volume
- Accumulation/Distribution Line: The current period’s Money Flow Volume is added to the previous period’s A/D value to form the A/D line:
A/D = Previous A/D + Current Period’s MFV
Importance of A/D indicator in Trading
The Accumulation/Distribution (A/D) Indicator provides insights into the strength of a market trend. It helps traders confirm the continuation of an existing trend or spot potential reversals by analyzing buying and selling pressure.
In an uptrend, if both the A/D line and price are making higher highs and higher lows, it confirms the strength of the upward momentum, signaling traders to hold their positions or go long.
Conversely, when both the price and A/D line form lower highs and lower lows in a downtrend, it confirms continued bearish momentum, suggesting traders short the asset or maintain short positions.
The A/D indicator also helps identify divergences between price and volume, signaling potential trend reversals. If the price reaches new highs but the A/D line does not, it may indicate that buying pressure is weakening, signaling an impending downtrend.
On the other hand, if the price hits new lows but the A/D line stays flat or rises, it can suggest that selling pressure is waning, pointing to a possible bullish reversal.
5. Klinger Oscillator
The Klinger Oscillator, developed by Stephen Klinger, is a technical indicator used by traders to predict long-term trends in money flow while maintaining sensitivity to short-term fluctuations.
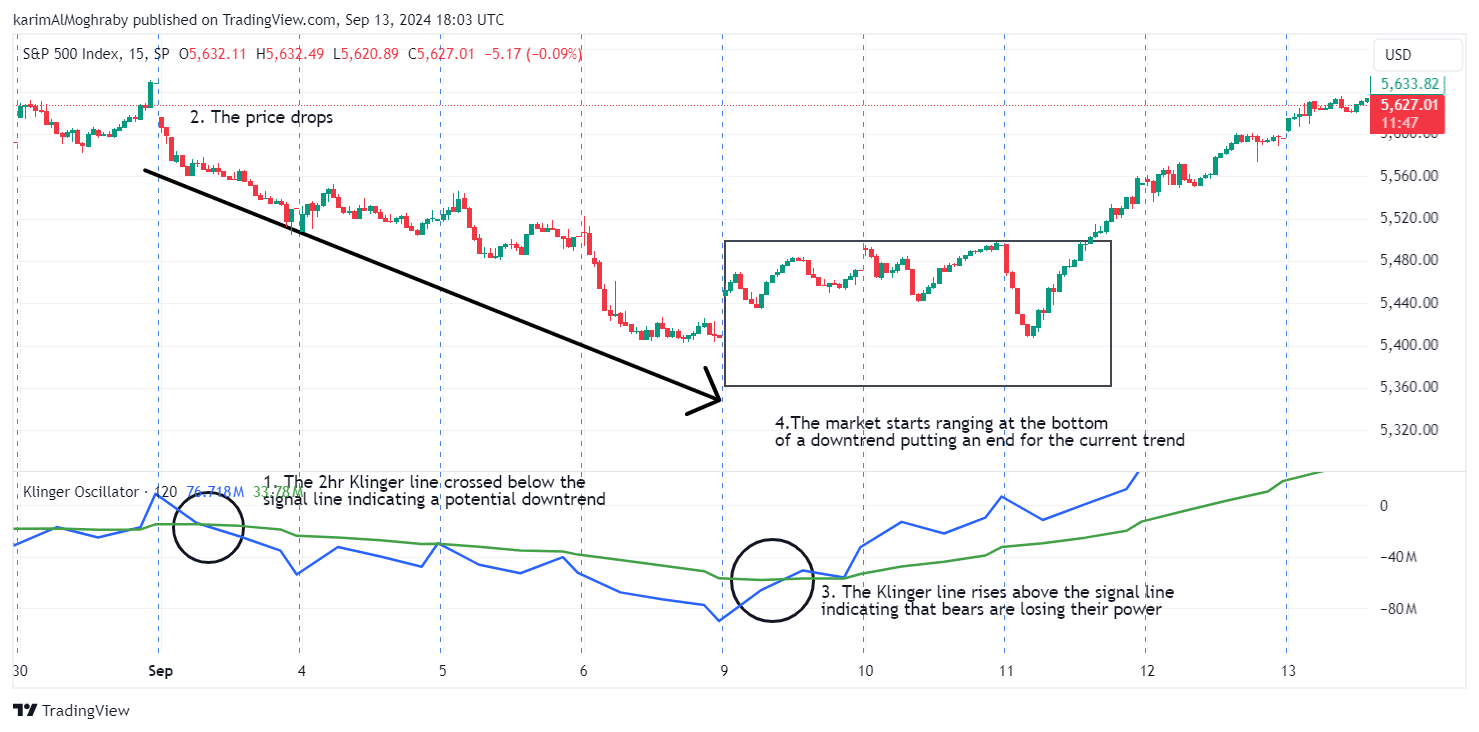
This indicator compares the volume flowing through an asset with its price movements and converts this relationship into an oscillator. The Klinger Oscillator can be used to detect reversals and follow trends, though it may produce false signals, especially when used in isolation.
It shows the difference between two exponential moving averages (EMAs) of "volume force" (VF), which takes into account volume, price, and trend. Traders primarily look for crossovers between the oscillator and a signal line (a moving average of the Klinger Oscillator) to generate buy and sell signals.
The indicator is based on Volume Force (VF), which measures the pressure exerted by volume on price.
Calculation of Klinger Oscillator
The Klinger Oscillator calculation consists of multiple components:
- Money Flow Multiplier: Determines the volume force direction. Money Flow Multiplier = [(Close - Low) - (High - Close)] / (High - Low)
- Volume Force (VF): Combines the Money Flow Multiplier with volume. VF = Volume × [2 × ((High - Low) / (Previous High - Previous Low)) - 1] × 100
- Klinger Oscillator (KO): The KO is calculated as the difference between two EMAs of VF: KO = 34-period EMA of VF - 55-period EMA of VF
- Signal Line: A 13-period EMA of the Klinger Oscillator is used as the signal line to trigger buy or sell signals.
Importance of Klinger Oscillator in Trading
One of the key uses of the Oscillator is spotting crossovers. When the Klinger line crosses above its signal line, it indicates a potential buying opportunity, signaling upward momentum. Conversely, when it crosses below the signal line, it can signal a sell opportunity, indicating weakening momentum or a downtrend.
The oscillator's position relative to the zero line is also critical for gauging trend strength. A move above zero suggests that upward momentum is building, while a move below zero implies that downward pressure is increasing. This makes it useful for confirming the direction of the prevailing trend.
6. On-Balance Volume (OBV)
The On-Balance Volume (OBV) indicator, introduced by Joseph Granville, is a momentum indicator that measures the cumulative buying and selling pressure to predict price movements. It operates on the principle that volume precedes price, meaning that changes in volume can forecast future price trends.
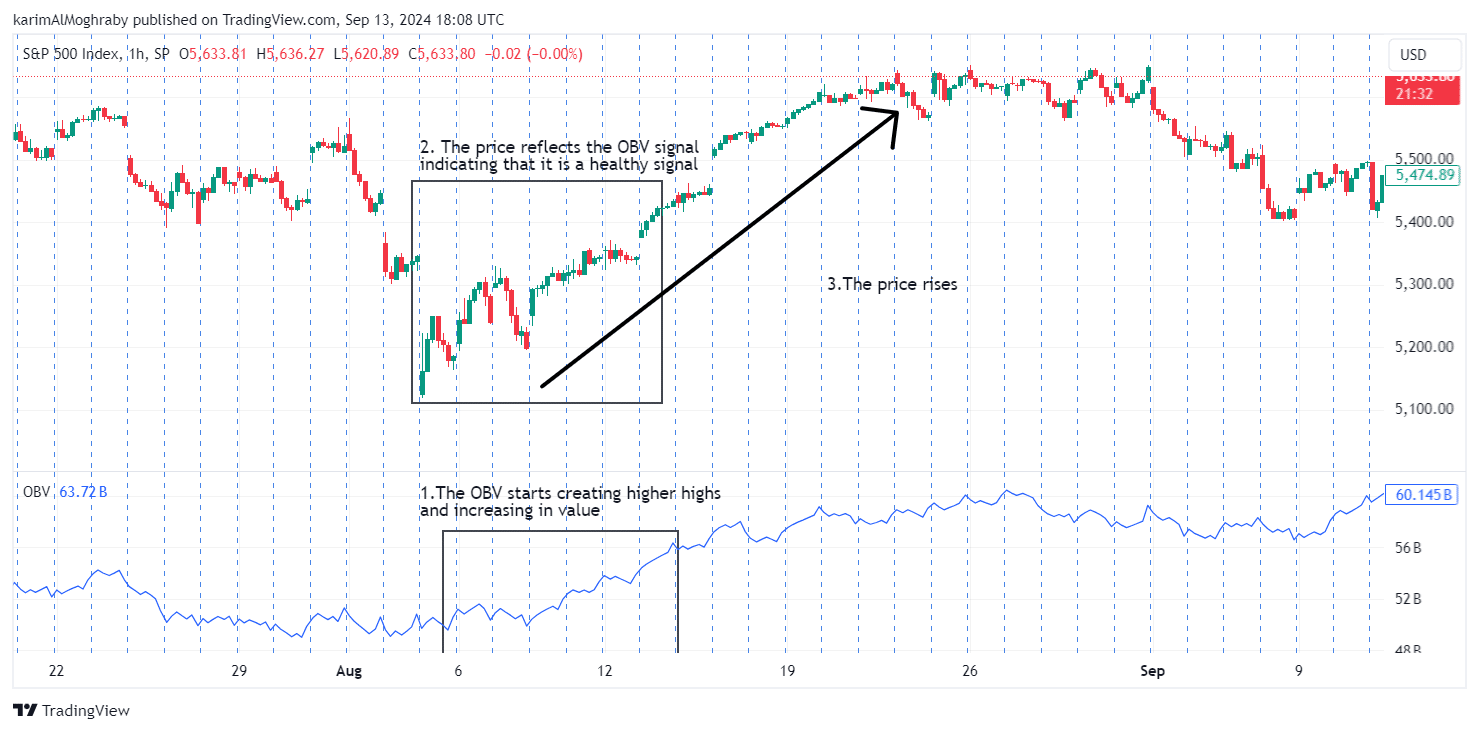
Calculation of OBV
The OBV calculation is straightforward but requires careful application:
1. Determine Volume Direction:
- Up Day: If the closing price of the current day is higher than the previous day’s closing price, consider the entire day’s volume as up-volume.
- Down Day: If the closing price is lower than the previous day’s closing price, treat the day’s volume as down-volume.
- Neutral Day: If the closing price remains the same as the previous day, the volume is neither added nor subtracted from the OBV.
2. Compute OBV:
- For an Up Day: OBV=Previous OBV+ Current Day’s Volume
- For a Down Day: OBV=Previous OBV−Current Day’s Volume
- For a Neutral Day: OBV=Previous OBV
Importance of OBV in Trading
The OBV indicator plays a crucial role in helping traders understand the strength of a trend and gauge market sentiment by analyzing how volume interacts with price movements.
A rising OBV, when aligned with increasing prices, suggests strong buying pressure, confirming the continuation of an uptrend. On the other hand, when OBV declines alongside falling prices, it reflects strong selling pressure, confirming a downtrend.
Traders can interpret this as a sign that sellers dominate the market, suggesting that the downward trend may persist.
Whereas for divergence, when the price makes higher highs but OBV forms lower highs, it indicates weakening buying momentum, signaling a potential reversal and future price decline.
Conversely, If the price makes lower lows but OBV rises with higher lows, it suggests growing buying strength, signaling a potential reversal and future price increase.
7. Chaikin Oscillator
The Chaikin Oscillator is a momentum indicator that evaluates the Accumulation/Distribution (A/D) line’s momentum rather than just the price alone.
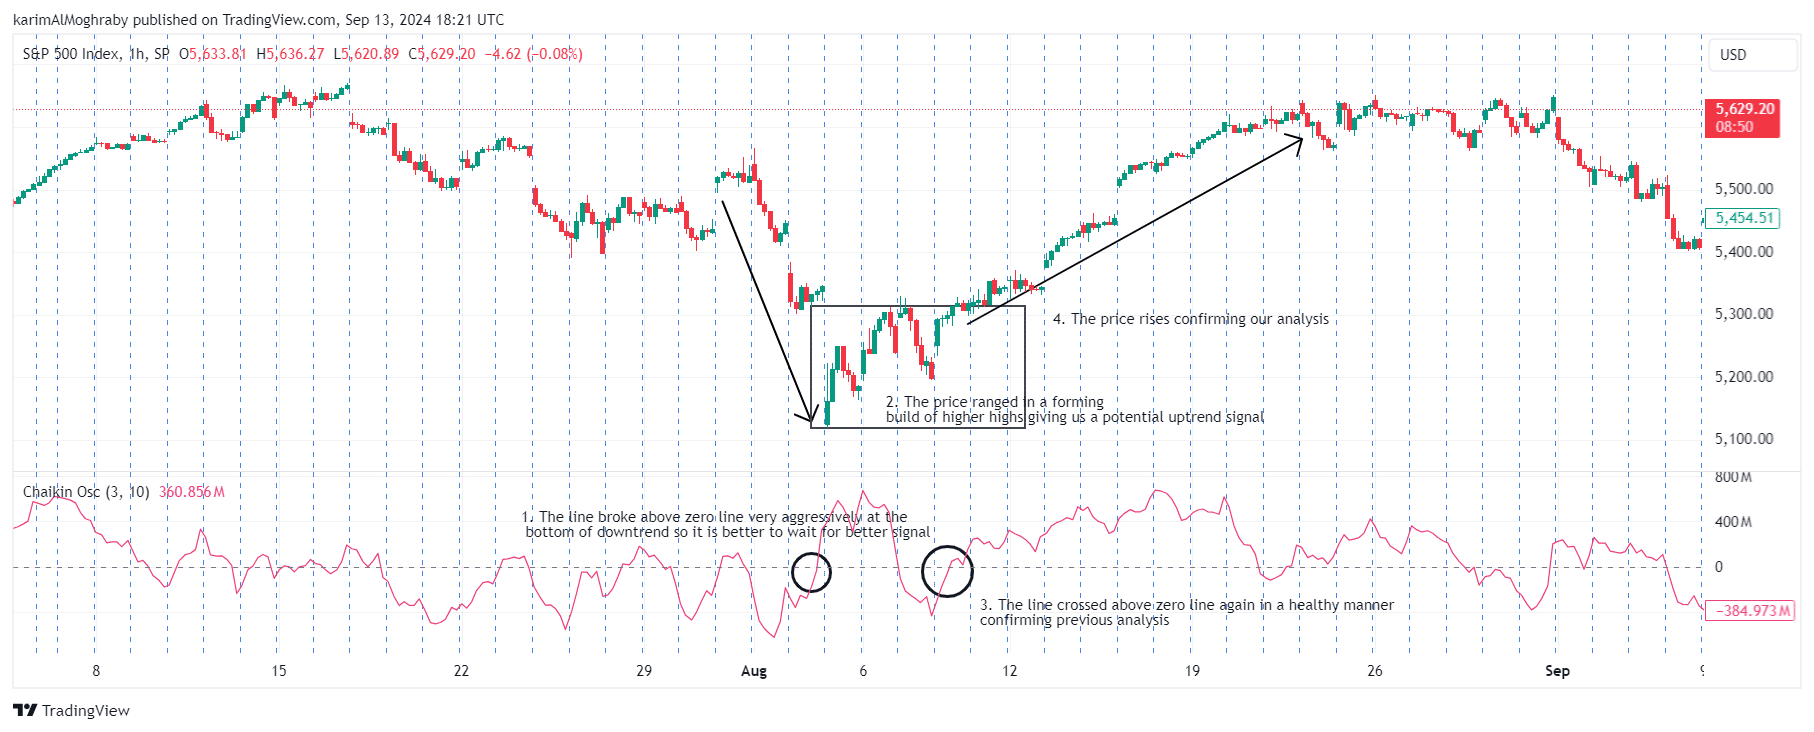
Developed by Marc Chaikin, this oscillator combines the concept of the A/D line with MACD model to assess the strength and direction of buying and selling pressure.
By analyzing the difference between two exponential moving averages (EMAs) of the A/D line, the Chaikin Oscillator provides insights into market trends and potential reversals.
Calculation of Chaikin Oscillator
1.Compute the Accumulation/Distribution (A/D) Line:
- Money Flow Multiplier: (Close-Low)-(High-Close)/High-Low
- Money Flow Volume (MFV): MFV=Money Flow Multiplier× Volume
- A/D Line: A/D Line=Previous A/D Line+ Current Period’s MFV
2. Calculate Two EMAs of the A/D Line:
Typically, the Chaikin Oscillator uses a short-term EMA (e.g., 3-day) and a long-term EMA (e.g., 10-day) of the A/D line.
3. Determine the Chaikin Oscillator:
The Chaikin Oscillator is the difference between the short-term EMA and the long-term EMA of the A/D line:
4. Chaikin Oscillator=Short-Term EMA−Long-Term EMA
Importance of Chaikin Oscillator in Trading
The Chaikin Oscillator is important in trading for several reasons. It aids in trend confirmation by signaling bullish conditions when it is above zero, as this indicates stronger short-term momentum compared to the long-term.
When the oscillator is below zero, it implies bearish conditions. Signal generation is another key function, as crossovers of the Chaikin Oscillator with the zero line or a signal line (if used) can highlight potential buying or selling opportunities.
A crossover above the zero line may suggest a buying opportunity, while a move below could indicate selling. Additionally, divergence analysis between the Chaikin Oscillator and the asset’s price can help identify potential trend reversals.
If the price is making new highs but the oscillator lags, it suggests weakening buying pressure and a possible decline. Conversely, new lows in price without a corresponding drop in the oscillator may signal a bullish reversal.
Final thoughts

Volume indicators are far more than just supplementary tools; they are foundational to developing a comprehensive and successful trading strategy. While price action offers insights into how the market values an asset, it is the volume that reveals the underlying strength or weakness driving those price movements.
Understanding volume enables traders to confirm trends, identify potential reversals, and gauge the intensity of both buying and selling pressure. Volume indicators such as VWAP, VWMA, MFI, A/D, Klinger Oscillator, OBV, and Chaikin Oscillator serve as essential instruments for gaining clarity on market sentiment and the sustainability of trends.
By incorporating these volume indicators into their trading analysis, traders can validate breakouts, and spot divergences, and assess the liquidity of their trades.
Each of these indicators provides a unique lens through which you can analyze market dynamics, whether it be identifying overbought or oversold conditions with the MFI, predicting shifts in accumulation and distribution with the A/D indicator, or confirming price trends with the OBV.
A well-rounded approach that integrates both price action and volume indicators offers a more in-depth understanding of market movements. This dual analysis allows you as a trader not only to sharpen your entry and exit points but also to mitigate risks by making more informed decisions.
In volatile or uncertain market conditions, volume indicators provide an added layer of confidence, helping traders stay ahead of potential reversals or failed breakouts.
Ultimately, the combination of volume analysis with other technical indicators creates a powerful, holistic trading strategy that enhances a trader’s ability to navigate the complexities of the market and improves their overall chances of success.
Disclaimer: The charts provided above are for illustrative purposes only and serve as visual representations of trading indicators. They do not contain any trading strategies, financial advice, or recommendations. Always conduct your research or consult with a qualified financial advisor before making any trading or investment decisions.
Take Your Trading to Next Level
Take Your Trading to Next Level
You Might Also Like:


