We hope you enjoy reading this blog post.
Become a Pro Trader by using our fine-tuned Indicators and Expert Advisors.
An Advanced Guide to Bollinger Bands Trading Strategies
As an algorithmic trader, you might be sometimes tempted to use multiple technical indicators on your charts. We’re not saying you shouldn’t do this; it’s just that sometimes they can give you contradicting signals.
Let’s say you are using a 20-period MA, the CCI, and the RSI. The current price is above the 20-period MA; the CCI shows the market is oversold while the RSI shows that the market is in an overbought condition. How do you trade then? If we’re right, you are stuck!
It is for this exact reason we love the Bollinger Bands. It removes the confusion from trading.
In this trading guide, we will analyze the Bollinger Bands in detail. At the end of this article, you will have learned the following:
Bollinger Bands: What is it, and how does it work?
Bollinger Bands is a technical indicator developed by John Bollinger in the 1980s.
This indicator is fundamentally made up of three lines. A moving average in the middle with two lines – one above and another one below the MA. These two lines are called bands.
Before we explain how the Bollinger Bands work, you first need to understand the concept of standard deviation. We’ll make it very brief.
Standard deviation is used to measure volatility. If you are trading the EUR/USD Forex pair, the standard deviation of the pair measures how the price of EUR/USD varies from its means.
Now back to Bollinger Bands.
The Moving Average – the middle line – could be a simple moving average (SMA) or an exponential moving average (EMA), depending on your preference. If you have set the MA at 20, it means that the closing price of the previous 20 candles will be averaged.
The upper and lower bands are merely standard deviations from the MA.
The upper band is two standard deviations from the MA, while the lower band is two standard deviations from the MA.
What this means is that the upper band will always be at a +2-standard deviation from the MA. Similarly, the lower band will always be at a -2-standard deviation from the MA.
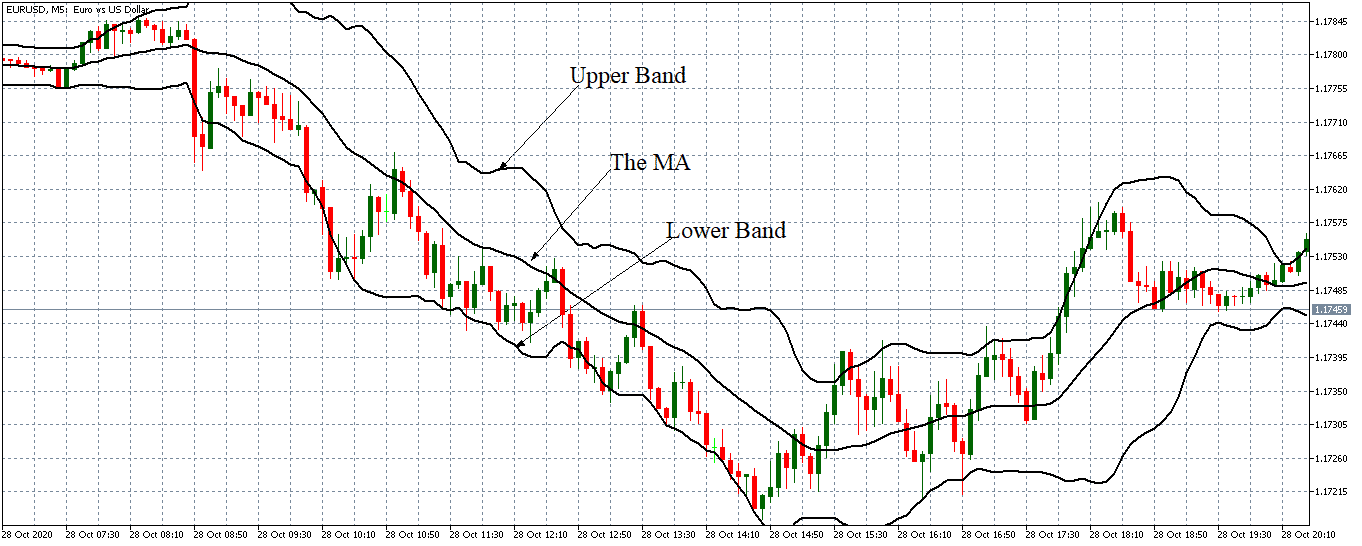
In this example, we have used the default settings of 20-period MA, +2 standard deviation for the upper band, and -2 standard deviation for the lower band.
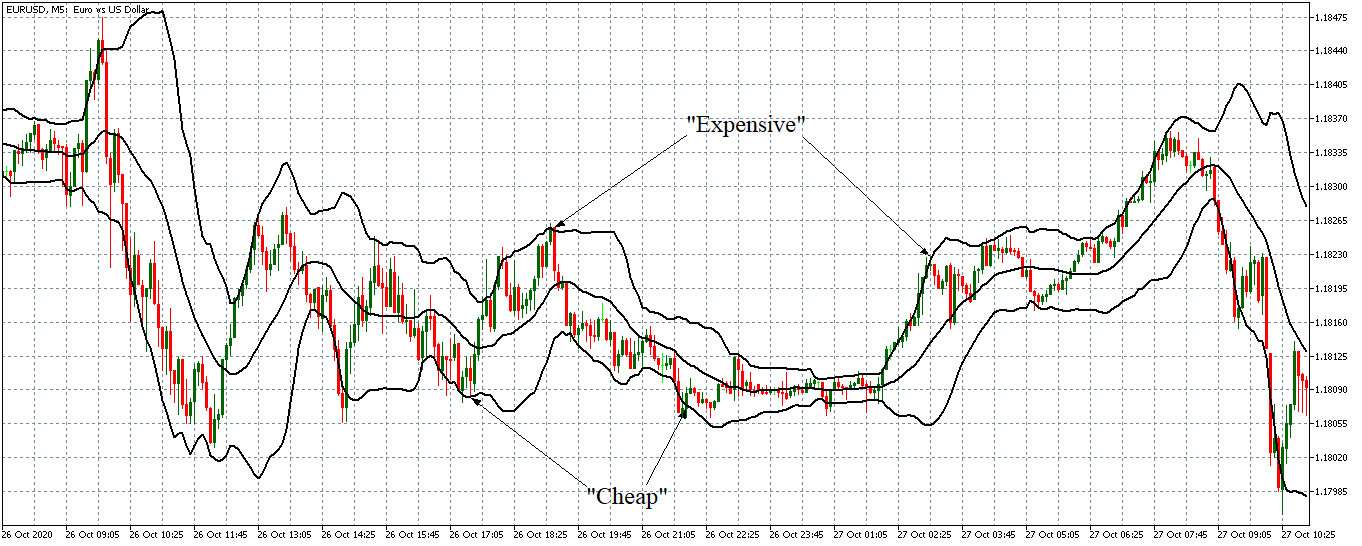
On a regular trading day, the price of a currency pair fluctuates. So, we can use the concept of standard deviation from the MA to determine if the price of a currency pair is low or high.
When the price reaches or is around the upper band, the currency pair can be said to be expensive. If the price nears the lower band or is trading closer to the lower band, it is said to be cheap.
Let’s consider this example:
Common Mistake with Bollinger Bands
It is a common rookie mistake for traders to short a currency pair immediately after it reaches the upper band and go long when it touches the lower band.
You should know that price can continue forming higher highs with the upper band going higher. A currency pair can also create lower lows, with the lower band trending lower. So, don’t always rush to open a position.
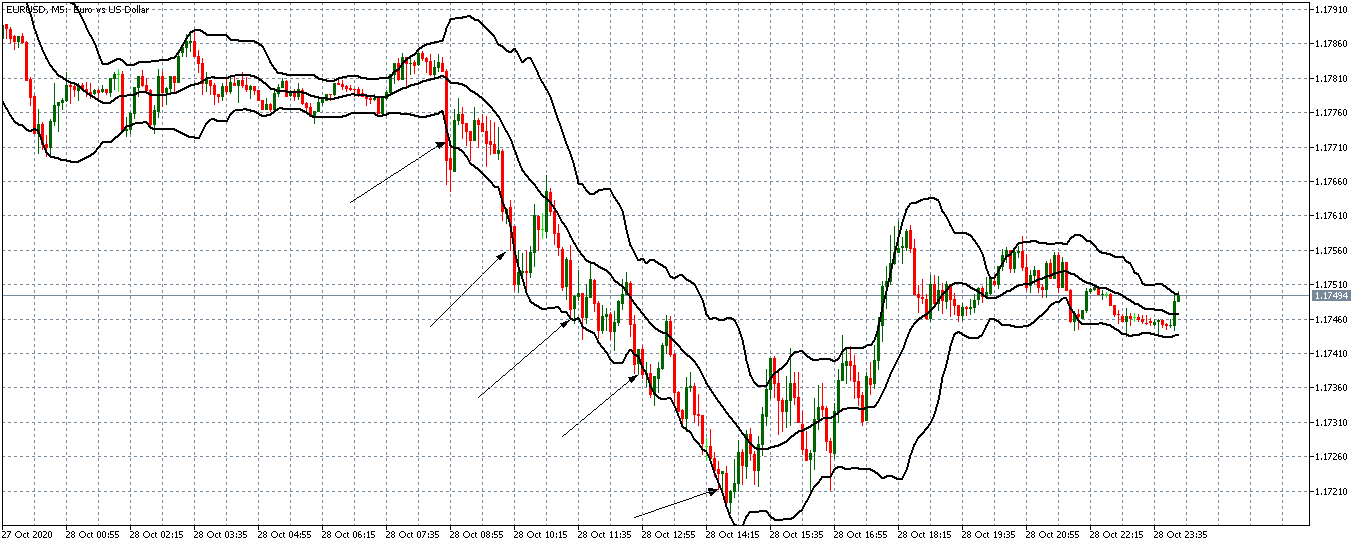
In this example, if you had gone long the moment the price reached the lower band, you would have lost.
You’re probably wondering; how then can I use the Bollinger Bands strategy to open a trade?
The Basic Bollinger Bands Trading strategy
The ultimate goal of a trader is to go long when the price is at the lowest and short when the price is at the highest.
But when using the Bollinger Bands to establish when the price is the highest and lowest, opening a position requires some finesse. The overall market trend should be showing signs of reversal – otherwise, you might crash and burn.
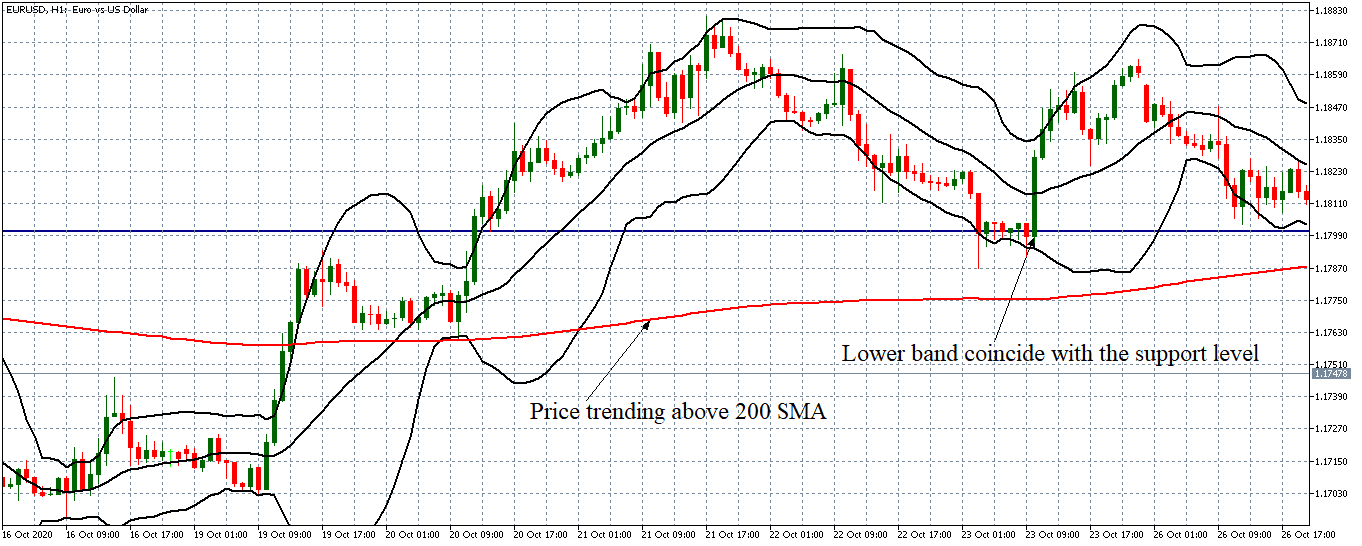
The best way to trade with Bollinger Bands is by using support and resistance levels. Look at the example below; the lower Bollinger Bands coincided with the support level. Also, notice that the price is trending above the 200-period SMA.
Forecasting Market Breakouts using the Bollinger Bands
Volatility is inherent in the Forex market. Any currency pair tends to fluctuate between periods of low and high volatilities.
For new traders, identifying this trend might be challenging; but with this Bollinger Bands trading strategy, your chances of spotting them are higher.
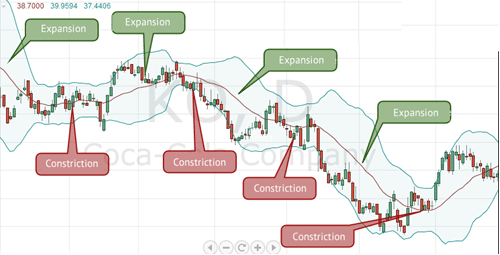
When the market is going through periods of low volatility, the Bollinger bands contract and are somehow closer together. In times of high volatility, they expand and become further apart.
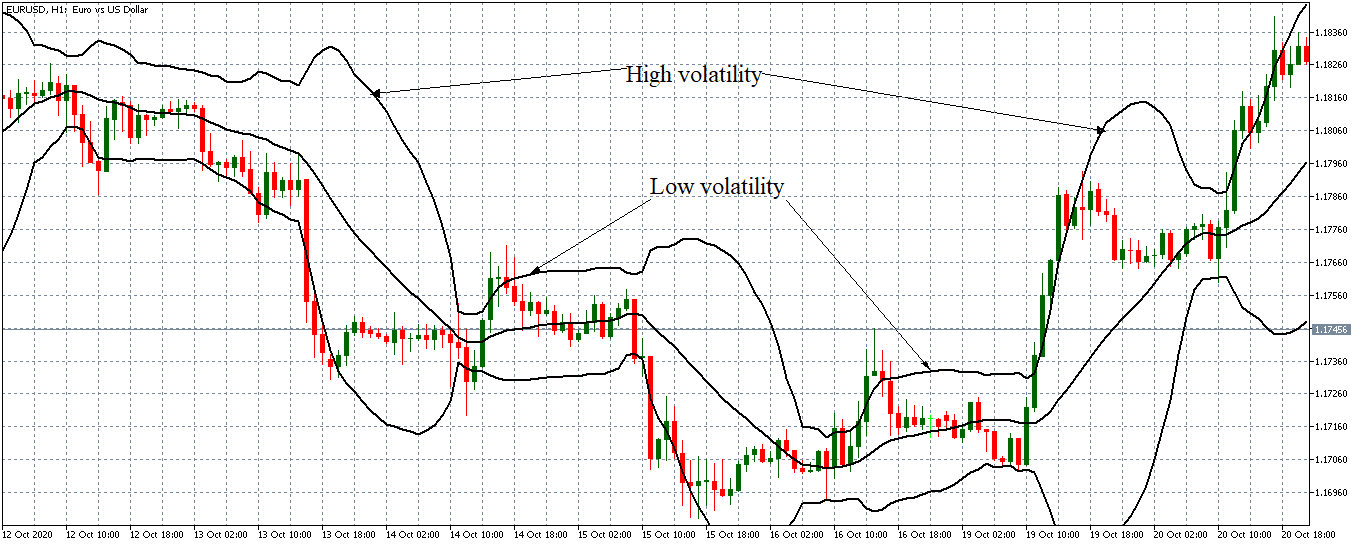
From this example, you’ll notice that the pair moves from low to high volatility and from high to low volatility.
The next question on mind then is, “…how will I know what direction the breakout will be.?”
Let’s answer this with an example.
We’ve noticed that bouts of high volatility follow long periods when the bands squeeze together. Let’s see if you can spot the direction of the breakout.
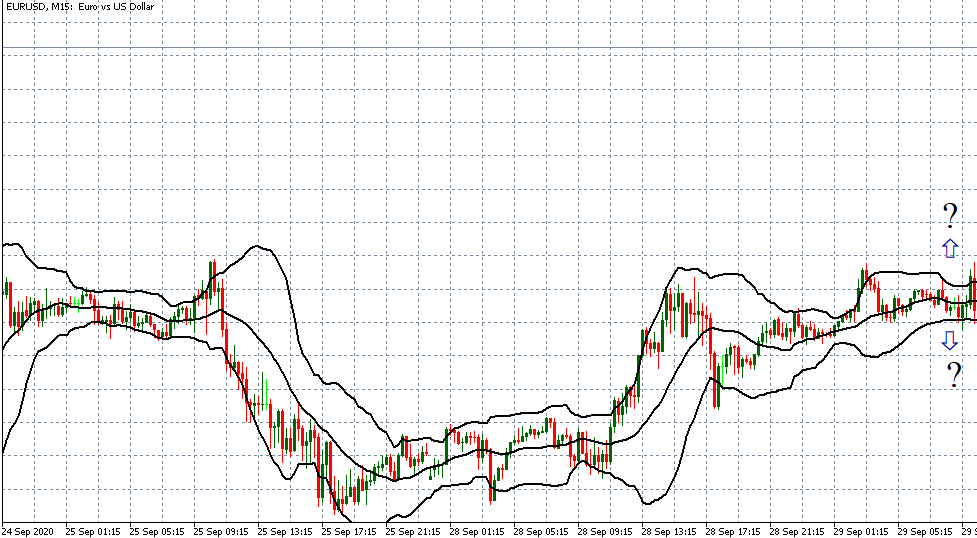
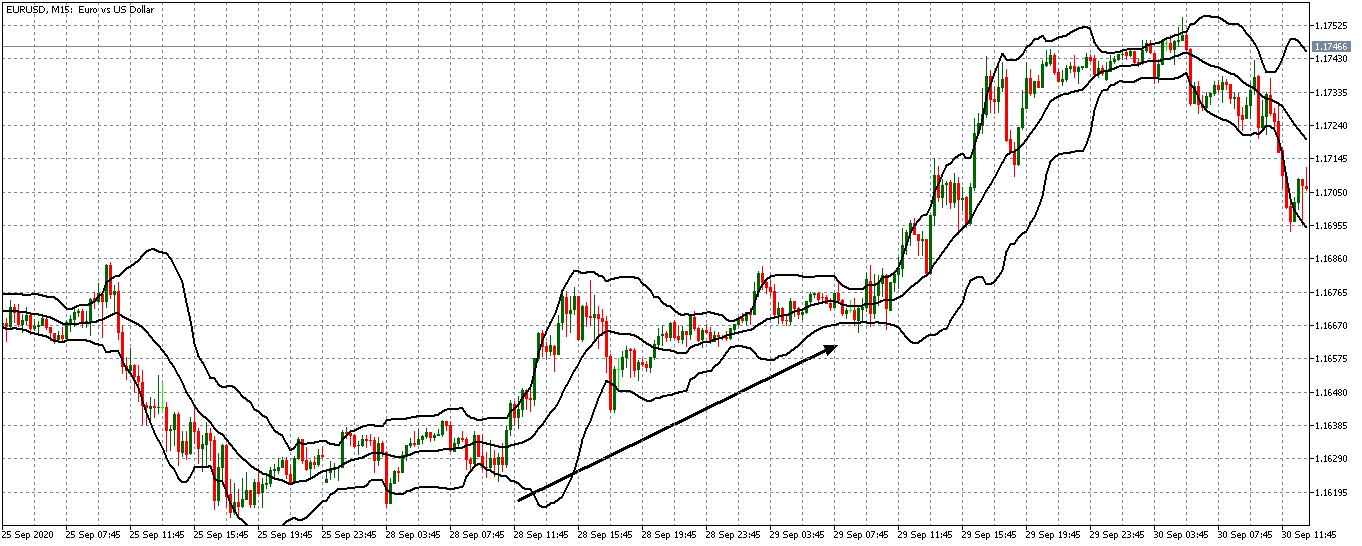
Just by glancing at the chart, you’ll notice that the most recent pattern is on an uptrend. Therefore, the most logical breakout would be upwards.
How to Find Trend using the Bollinger Bands?
If you didn’t know this Bollinger Bands trading strategy already, now you can. Moving averages are used to establish trends on price charts.
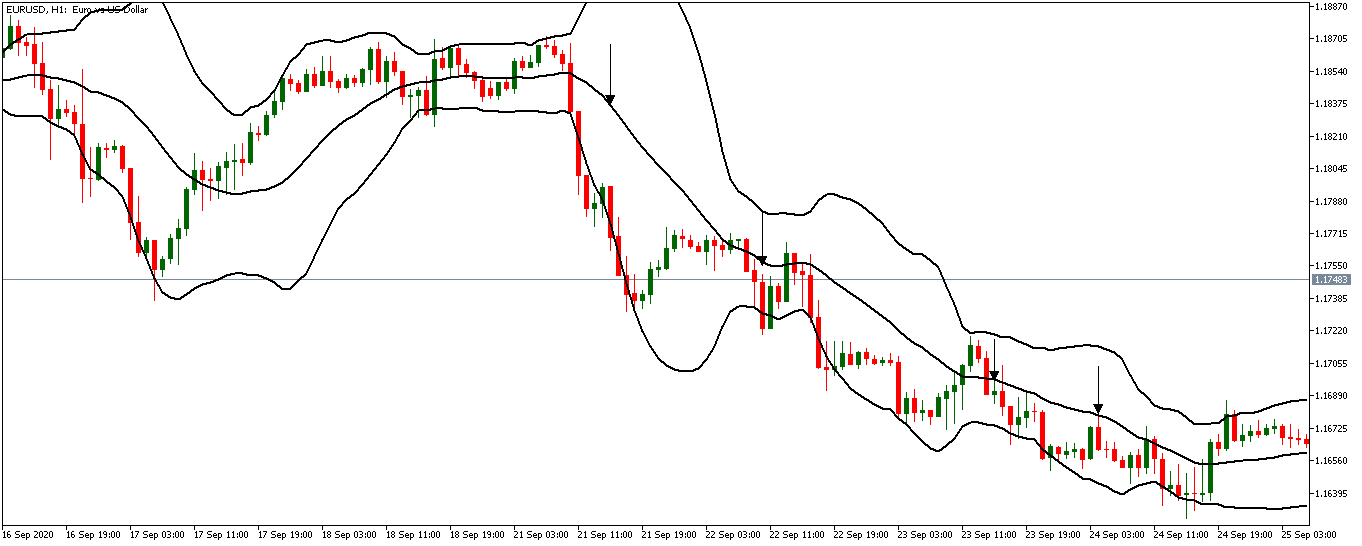
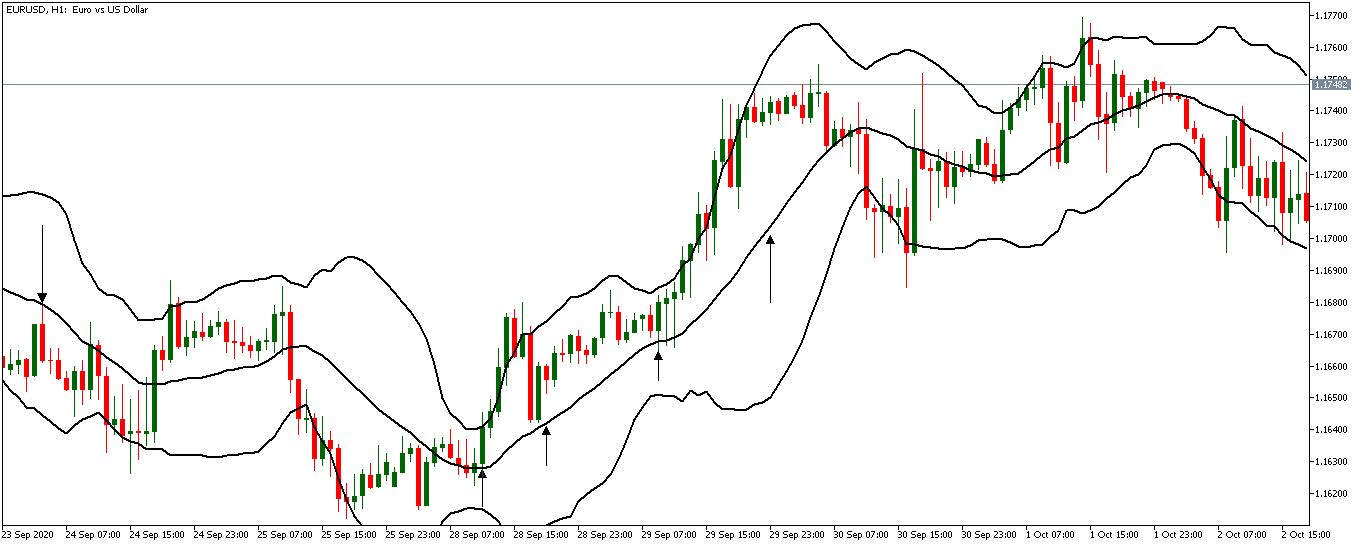
Remember, the middle line of the Bollinger Band is 20-period MA. When the markets are trending, this middle line can be a strong indicator of the direction of this trend. Here’s a simple way of identifying trends using the middle line.
When the MA line is sloping downwards, and the price is bouncing off the MA like a resistance line, it means the market is trending downwards. You can go short.
When the MA line is sloping upwards, and the price is bouncing off it like a support level, it means that the market is trending upwards. You can go long.
Combining RSI and Bollinger Bands To get Accurate Trading Signals
We have already established that as a technical indicator, the Bollinger Bands is terrific at identifying the highest and lowest price points.
Sometimes knowing the highest and lowest points is not enough. You also need to understand the magnitude of these points – the strength behind the highest and lowest price points.
This Bollinger Bands trading strategy will help you determine if the price will continue trending outside the outer bands or not.
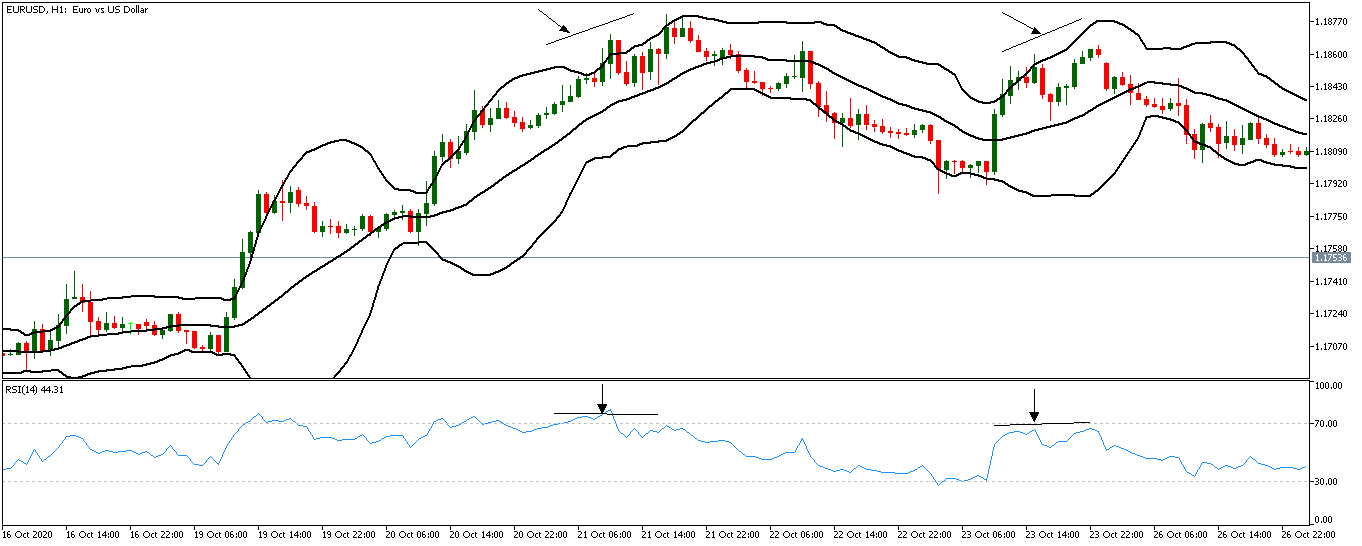
The Relative Strength Index (RSI) indicator can help you with this by identifying the divergence in the RSI.
Here’s what we mean by divergence in the RSI
- A bearish RSI divergence occurs when the price forms higher highs, but the RSI forms lower highs. This scenario shows market weakness.
- A bullish divergence typically occurs when the price is forming lower lows when the RSI indicators form lower highs. This instance shows market strength.
Let’s see how you can combine these two divergences with Bollinger Bands.
When the price is at the upper band, you can observe the RSI indicator to see if there is any sign of bearish divergence, which shows weakness in the market.
When the price reaches the lower band, you observe the RSI indicator for signs of bullish divergence that shows the strength of the market trend.
Predicting the Market Reversal using Bollinger Bands
Bollinger Bands can also be used to predict potential reversals.
Like a band, when it stretches too far, it always tends to snap back. And this is where you can spot the market reversal.
But, as we noted earlier, the price can sometimes just trend beyond the outer bands for extended periods. So, to help you pinpoint with some degree of confidence when the market reverses, you need to consider the following.
- Use recent market trends to draw the support and resistance levels.
- Use candlestick patterns to show market exhaustion.
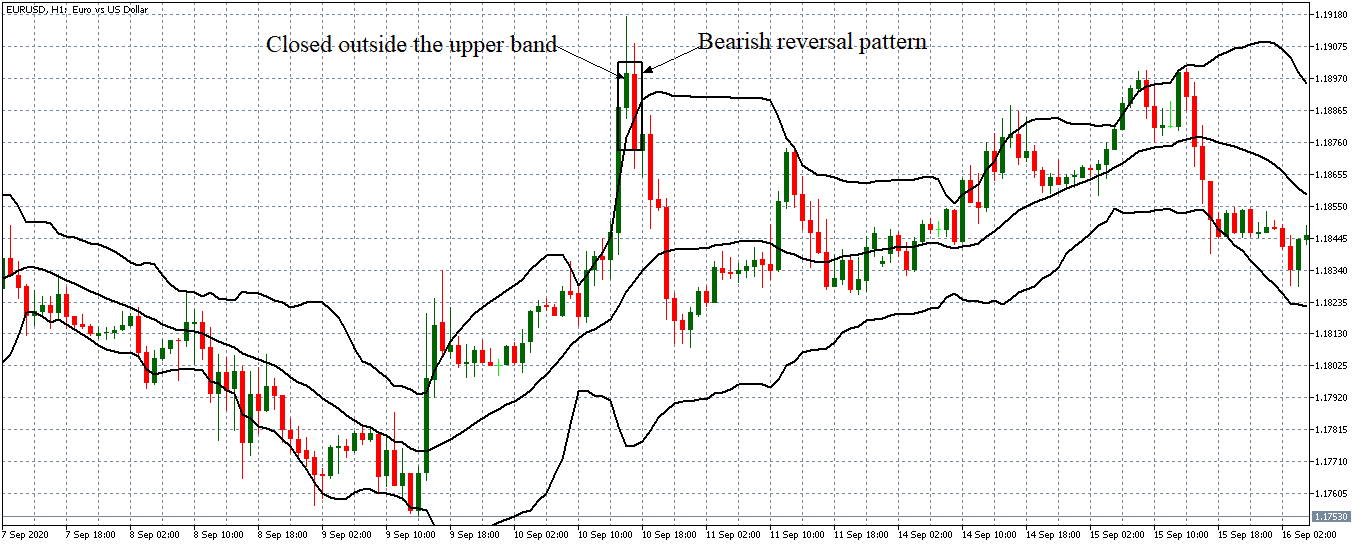
In practice, if you notice a candle closing above the upper band, it can be a clue that the market is overly stretched. If any form of bearish reversal pattern follows this, then it's a signal that the market is reversing to a downtrend.
Note that you can adjust the parameter of the Bollinger Bands as you please. This will help you identify overstretched market conditions depending on your timeframe.
Conclusion
As we conclude, here are a few things you should keep in mind.
- Depending on your trading style, you can use Bollinger Bands in any timeframe.
- When the market is in an uptrend, you can go long when the price is near the lower band.
- Likewise, if the market is in a downtrend, you can short when the price reaches the upper band.
- The combination of Bollinger Bands and the RSI indicator will help you pinpoint highest and lowest price levels and along with market momentum.
- When the upper and lower bands are closer together, it could signal an impending high volatility period.
- Bollinger Bands can also serve to form significant support and resistance levels.
We hope you find these Bollinger Bands trading strategies informative. If you have any questions, please let us know in the comments below. Cheers!
related resources


