We hope you enjoy reading this blog post.
Become a Pro Trader by using our fine-tuned Indicators and Expert Advisors.
How to Use Fibonacci Retracement Tool in Forex
Using the Fibonacci retracement tool, you can elaborately draw the support and resistance levels. The Fibonacci retracement levels are used to show potential regions of trend reversals or breakouts.
On the MetaTrader platform, the Fibonacci retracement tool is located among the ‘drawing objects.
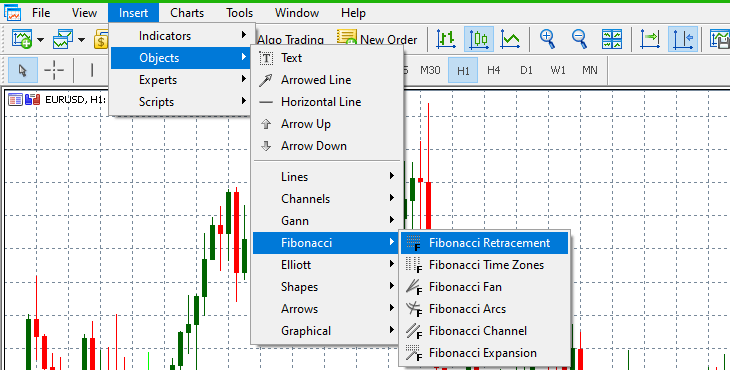
Fibonacci retracement levels are horizontal lines that correspond to Fibonacci numbers in percentage form. These levels range from 23.6%, 38.2%, and 61.8%. 0%, 50%, and 100% are also included in the Fibonacci retracement levels, although they are not part of the Fibonacci number sequence.
Determining the Fibonacci Levels
Don’t worry; we’re not going to do any calculations in this section to derive the Fibonacci number sequence. We’ll show you how to use the Fibonacci retracement tool to identify the Fibonacci levels on your price charts.
Remember, the Fibonacci retracement works best in a trending market. Therefore, to establish the Fibonacci retracement levels, we have to identify the most recent highest and lowest price points.
To find the support levels in a downtrend, select the Fibonacci retracement tool, then click on the highest price level and drag it to the lowest price level.
Similarly, to establish the resistance levels in an uptrend, select the Fibonacci retracement tool, then click on the lowest price level and drag it to the highest price point.
How to Use Fibonacci Retracements Levels?
As a trading strategy, Fibonacci retracement is regarded as being predictive since it tries to establish the future movement of an asset’s price.
Here’s the primary idea behind using Fibonacci retracement in trading. Go long in an uptrend along with the Fibonacci retracement support.
Conversely, short the market along with a Fibonacci resistance level when the market is on a downtrend. Keep in mind that the Fibonacci retracement works best in a trending market.
Ideally, when the price adopts a new trend, it is expected to retract from the previous price level before beginning another trend. This property makes it easier for traders to set the ‘take profit’ and ‘stop-loss’ levels when they open a position.
In case you find it challenging to draw the fibo levels manually, we have an Auto Fibonacci indicator that automatically places the fibo levels using the maximum and minimum points available on the chart.
Trading an uptrend with the Fibonacci Retracement Tool
The first step is to identify the lowest price level.
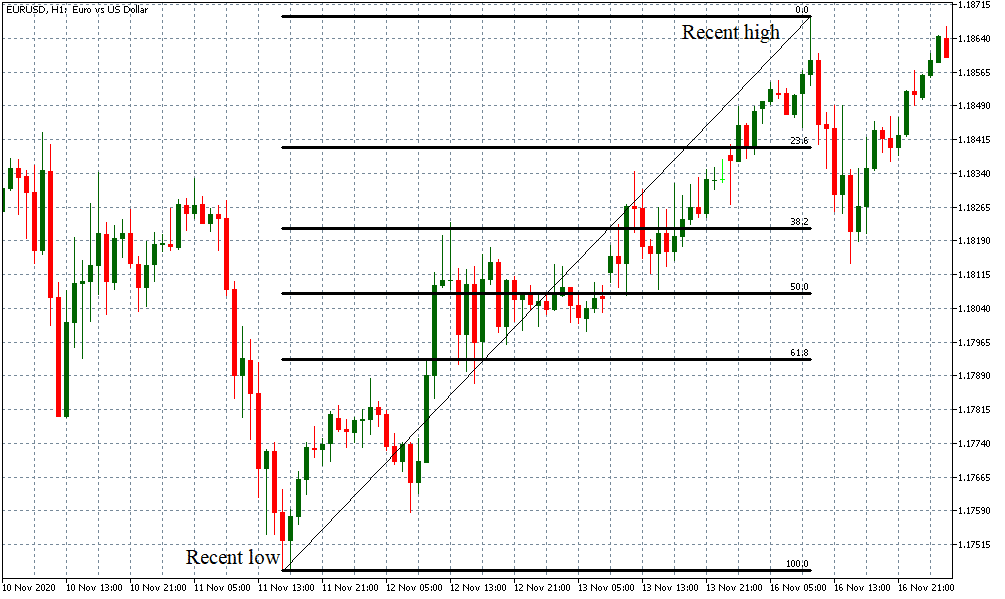
In this uptrend, you can see the Fibonacci levels automatically established at 100%, 61.8%, 50%, 38.2%, 23.6%, and 0%. In an uptrend, we expect that these levels serve as support levels for the price.
When trading in such an uptrend, you can expect the price to fluctuate from the recent highest high and retrace to one of the established Fibonacci support levels. After retracing back to the support level, the price then adopts a new uptrend. Here’s an example.
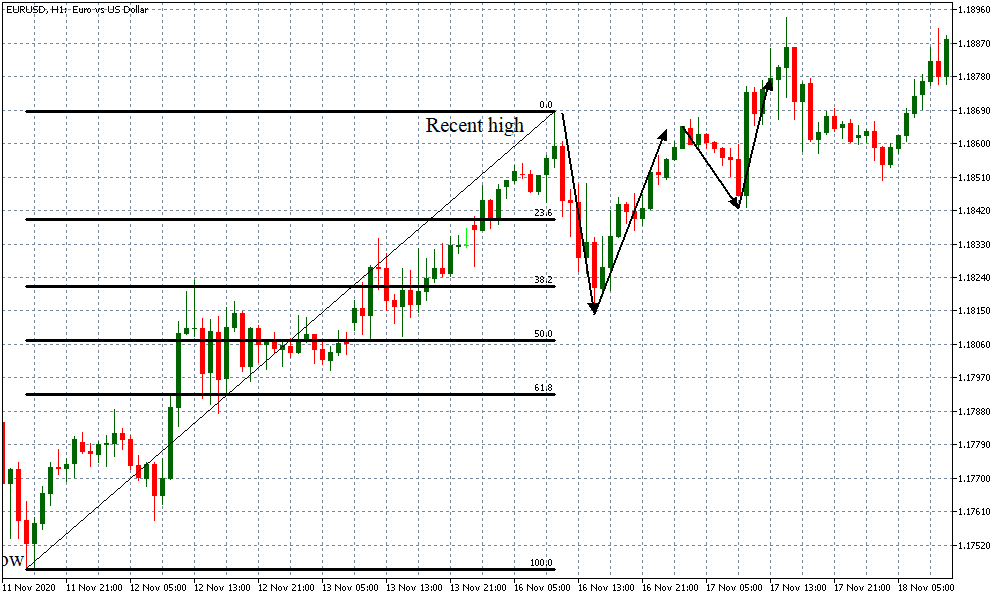
In this example, we can notice that the price level retraced through the 23.6% Fibonacci level then bounced off the 38.2% support level. After reaching the highest high, the price retraced back to the 23.6% level then adopted a renewed uptrend that broke through the recent high.
So, how would you know when to go long when using the Fibonacci retracement tool? It’s simple. When the price retraces from the recent highest high, please pay close attention to when it reaches the Fibonacci support levels.
Once the support level is breached, but the next candle after the breach doesn’t close below the support level, this is your signal to go long. In the above example, the ideal point of entry for a long trade would have been when the price breached the 38.2% level, and the next candle closed above the level.
If the price breaches the support levels and the next candle closes below it, do not initiate a trade. Instead, wait for the price to retrace to the next Fibonacci level. In the above example, the price breached the 23.6% level during the first retracement, but the next candle closed below this level.
However, in the second retracement, when the price breached the 23.6% level, the next candle closed higher, and then adopted a new uptrend.
Using the Fibonacci Retracement tool in a downtrend
In a downtrend, the first step is to identify the highest price point, then draw the Fibonacci retracement to the most recent lowest price level. Here’s an example.
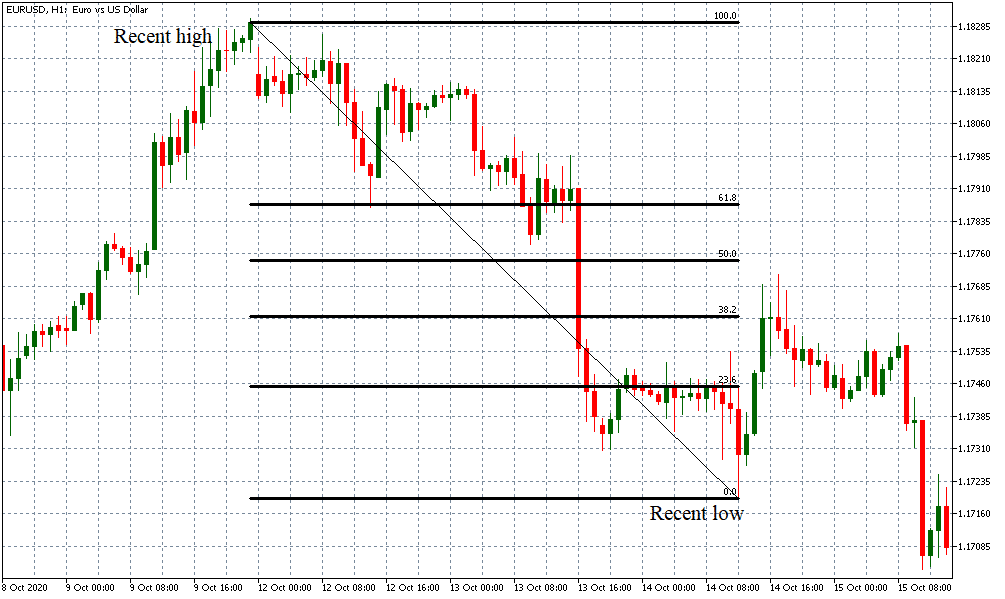
In this downtrend, the Fibonacci levels are automatically set at 100%, 61.8%, 50%, 38.2%, and 23.6%. In a downtrend, these levels will serve as resistance levels. In this example, the price retraced from the recent lowest low back to the 38.2% resistance level before adopting a new downtrend.
To generate a sell signal using the Fibonacci retracement levels, pay close attention to how the resistance levels' breach occurs. When the price retraces and breaches a Fibonacci resistance level, a sell signal is generated depending on whether or not the next candle after the breach closes above the resistance level.
If the candle after the breach closes below the resistance level, the sell signal is generated. If the candle after a breach closes above the resistance level, do not initiate any positions but wait for the price to reach the next resistance level.
Using Fibonacci Levels with Pending Orders
In the forex market, pending orders are instructions to your broker to execute a specified trade when specific pre-set conditions are attained in the market.
Note that these orders are typically executed at a future time or date. When using the MT4 platform, there are four primary pending orders: buy limit, sell limit, buy stop, and sell stop orders.
Remember that the Fibonacci retracement tool helps to identify the support and resistance levels accurately. Using this tool, you can take advantage of these levels to set the level where these orders can be executed.
Buy limit and Sell Stop Orders using Fibonacci Retracements
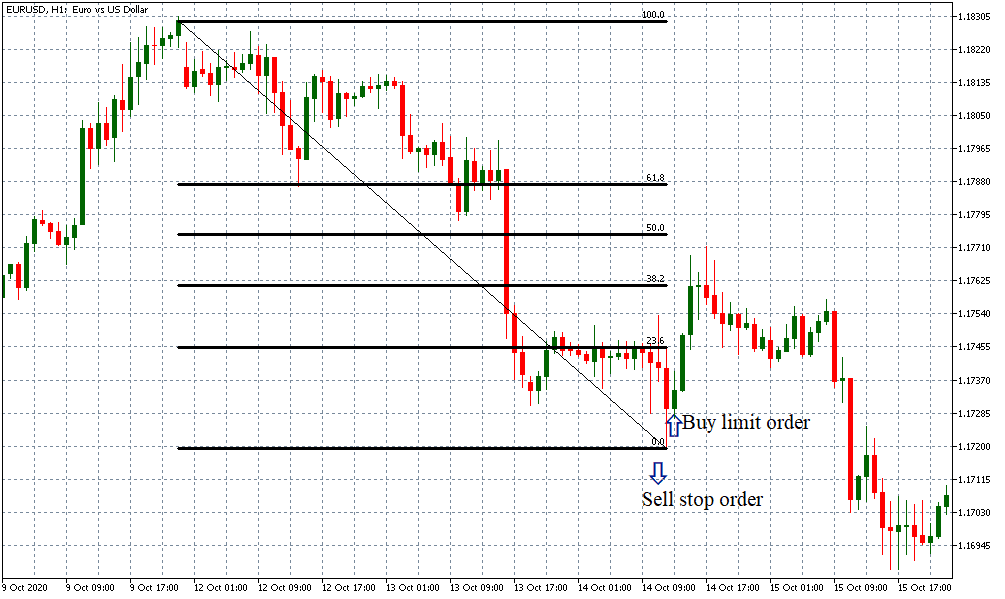
A buy limit order is an instruction for your broker to execute a long trade when the price of a currency pair reaches a specified level that is lower than the current market price. In this case, the market needs to be in a downtrend.
On the other hand, a sell stop order instructs your broker to execute a short trade when the price of a currency pair breaches a specified level lower than the current market price.
Both these instances depend on the market to be on a downtrend for the lowest low to be reached. In a Fibonacci retracement, the lowest low in a downtrend is the 0% level.
Therefore, if the price reaches this level and rebounds, the buy limit order will be triggered. The sell stop order will be triggered if the price breaches the 0% level.
Here’s an illustration.
Sell Limit and Buy stop Orders using Fibonacci Retracement
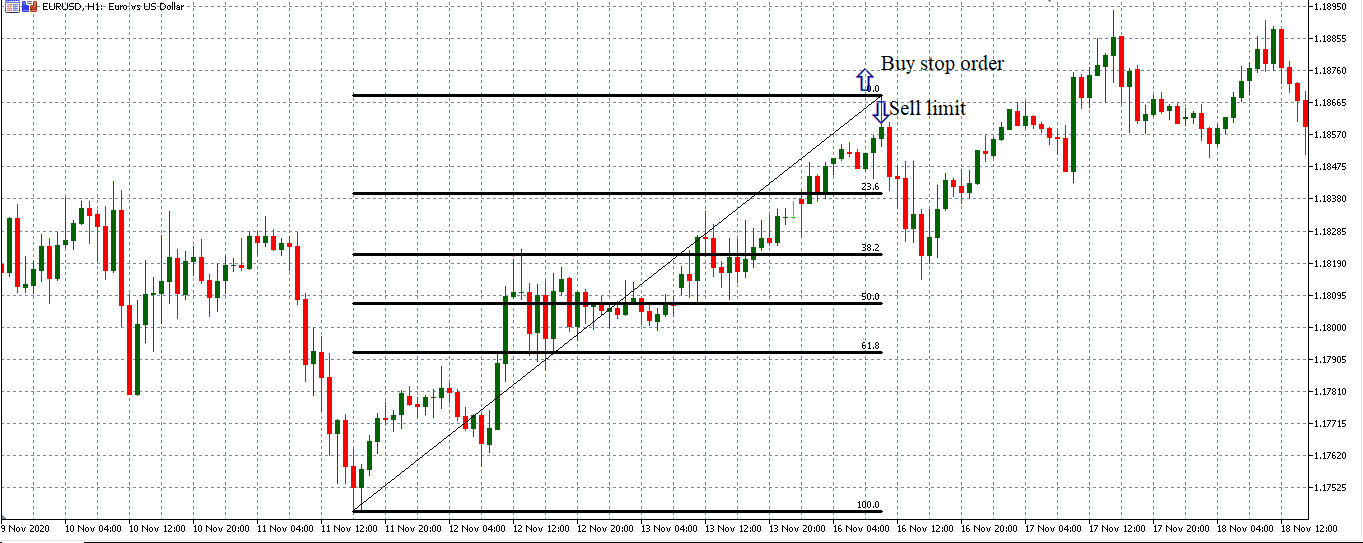
A sell limit order is an instruction for your broker to execute a short trade when a currency pair's price reaches a specified level above the current market price. That means the market needs to be on an uptrend.
A buy stop order is an instruction for your broker to execute a long trade when the price of a currency pair breaches a specified level above the current market price.
Since both these orders' execution requires the market to be on an uptrend, you can use the Fibonacci retracement to identify the highest high.
In an uptrend, this level is at 0%. So, when the price reaches the 0% level during a retracement, your sell limit order will be executed.
On the other hand, if the price breaches the 0% level, it will trigger your buy stop order. Here’s an illustration.
How to use Fibonacci retracement tool to set ‘take profit’ and ‘stop-loss’ levels?
The Fibonacci levels are also critical when establishing the levels where you can exit a trade. It helps to maximize your profits and minimize your downside exposure on a trade.
There are several ways to establish the take profit and stop-loss levels. However, setting these levels the most straightforward and uncomplicated way is to use the next Fibonacci level.
If you execute a long trade at the 38.2% level, you can set your take profit at the 23.6% level and the stop loss at the 50% level.
Similarly, if you execute a short trade at the 38.2% level, your take profit level will be set at the 50% mark and the stop loss set at the 23.6% level.
However, for most traders, stop-loss trailing can be an efficient way of setting the stop-loss levels. Since the trailing stop order is dynamic, it ensures that you are exposed to the price movement's upsides for as long as possible, thus maximizing your profits.
Conclusion
Fibonacci retracements are not foolproof. The levels established merely indicate that it is more likely for an asset's price to find support or resistance. There are no guarantees that these levels will hold.
Remember always to use the Fibonacci retracement tool with other technical indicators to affirm the price trend and momentum. All the best!


