We hope you enjoy reading this blog post.
Become a Pro Trader by using our fine-tuned Indicators and Expert Advisors.
How to Find the Best MACD Settings for Your Trading Strategy

You've likely heard the saying ''never trade against the trend''. In the world of Financial markets trading, the ability to identify a trend is crucial for attaining an edge.
Understanding the best macd settings might be the knowledge you need to start trading these trends.
The (MACD) or Moving Average Convergence Divergence, is a popular indicator in the trading world, for its historically proven effectiveness in identifying trend changes in the markets, so mastering the MACD settings is essential for effectively integrating this oscillator into your trading strategies.
In this article, we will cover the best parameters for MACD and provide an in-depth understanding of its functionality, empowering you to add it effectively into your trading strategy to improve your market approach.
What is MACD?
The Moving Average Convergence Divergence (MACD) created by Gerald Appel in the late 1970s is a trend-following momentum indicator showing the relationship between two Exponential moving averages (EMAs) concerning the traded security.
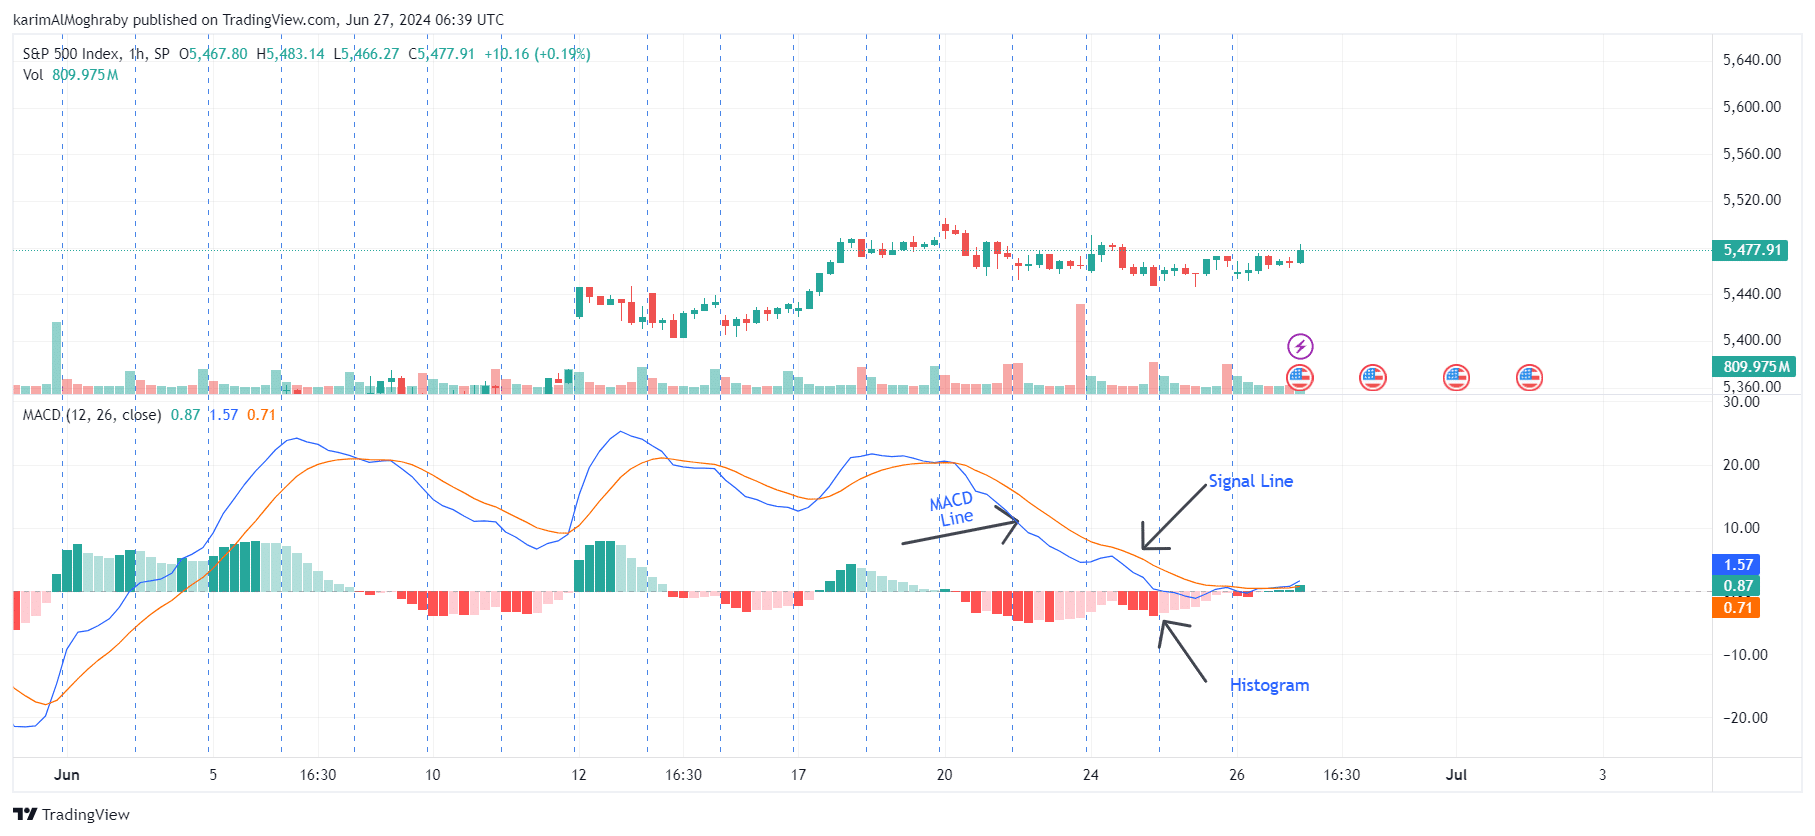
The MACD oscillator is built from three main components, a signal line, a MACD line, and a histogram. When combined they provide valuable insight into the overall market trend, potential reversals, and momentum.
It’s not just about price changes but about understanding the underlying strength or weakness in a market.
How MACD works?
The signal line, also known as the DEA, is calculated as the 9-day EMA of the difference of EMA 12 and EMA 26. MACD line crosses, where the MACD line crosses the signal line, can indicate potential entry and exit points for swing traders, assisting in making buy and sell decisions.
MACD Calculation
The Moving Average Convergence/Divergence (MACD) is determined using a 12-day Exponential Moving Average (EMA) and a 26-day EMA, both derived from closing prices. Initially, the convergence and divergence (CD) values must be computed by subtracting the 26-day EMA from the 12-day EMA.
To elaborate:
MACD Line = EMA12−EMA26
Signal Line = EMA9(MACD Line)
MACD Histogram = MACD Line−Signal Line
And for clarification the EMAt =α closing pricet +(1-α) EMAt-1. Where t resembles the day of EMA and α denotes the degree of decrease or α = 2/ (t – 1)
Choosing the Best MACD Settings
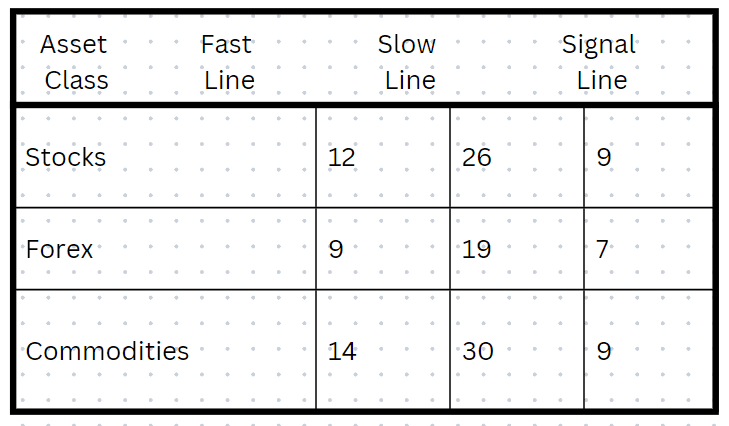
Whenever you log in to any screening platform and apply the oscillator you will realize that the default MACD settings look like ''12, 26, 9”
Where 12 is the faster exponential moving average (EMA).
26 the slower EMA.
9 is the signal line or the 9-period EMA of the MACD line.
Please keep in mind that every individual has a different point of view on the market and a different trading style, so choosing the best settings for macd or the best exponential moving averages settings can be tremendously subjective.
Some prefer to work with this setting, but keep in mind that it all depends on your trading strategy and the patterns you are using.
To indicate the best macd settings for you, experimenting and testing are a must.
Tuning The MACD Settings
Whenever you wish to adjust your MACD, you must consider several factors that might save you the headache of suffering losses including trading style, market volatility asset class, and time frame.
Adjusting MACD for Different Market Conditions
High Volatility: Use shorter EMAs to capture quick movements and trends. EMA setup example: 14 (Fast), 30 (Slow).
Low Volatility: Utilize longer EMAs to avoid frequent false signals. EMA setup example: 10 (Fast), 22 (Slow).
Optimizing MACD for Various Asset Classes
Various asset classes carry distinct characteristics and volatilities, necessitating tailored and optimal MACD settings for different pairs.
For example, the settings suitable for highly liquid stocks may differ from those suitable for forex pairs, commodities or cryptocurrencies, owing to variations in market structures and trader behaviors.
Calibrating MACD settings for your trading style
- Short-Term Trading: Use shorter EMAs (e.g., 6-day and 13-day EMAs) to make the MACD more responsive to recent price changes, some debate that this is the best macd setting for 5 minute chart.
- Long-Term Trading: Use longer EMAs (e.g., 19-day and 39-day EMAs) to smooth out short-term volatility and focus on longer-term trends.
MACD Setting for Day Trading
The MACD is a very useful and interesting indicator for day traders. Merely, waiting for a signal line crossover and understanding its meaning. When the MACD crosses above the signal line, it might be a sign to buy.
On the other hand, when it crosses below, it is a probable sign to sell.
But it is more complex than that since trading is not gambling, or execution and hope.
You need a comprehensive market view, which is derived from price action, divergence, and a broader market context.
Best MACD settings for day trading
Tuning the MACD intraday settings can significantly impact your overall trading strategy especially when the market is volatile. For instance, the best macd settings for 5 minute chart on a high volatile pair differ from those for 1-hour or 4-hour timeframes.
Best MACD Settings for 5-Minute Charts: scalpers might find reducing the standard settings provides more actionable signals. For instance, a 6, 13, 4 MACD settings might be a better fit.
MACD Settings for 30-Minute Chart & 1-hour Chart: Surprisingly traders prefer to stick with the default settings for 30,60-min timeframe 12,26,9. As it is considered a good balance between signal frequency and reliability.
MACD Settings for 4-Hour Chart: Adjusting the MACD setting to 8, 24, and 9 can enhance its performance by reducing the number of false signals and improving the accuracy of entry and exit points. We also have an MTF MACD indicator which displays the direction of MACD across multiple timeframes.
Focus on adjusting the sensitivity of the MACD to assist you better with your trading style and the specific assets you are forecasting.
For a deeper understanding of how to leverage MACD crossovers, Divergence, trend filtering, and histogram analysis, make sure to stick to our next section where we explain each of these strategies.
Using MACD in Day Trading
There are several ways to utilize MACD for a better trading journey. Some of these strategies are discussed below:
1. Buy and sell crossovers
This is the most common method or use case of the MACD strategy.
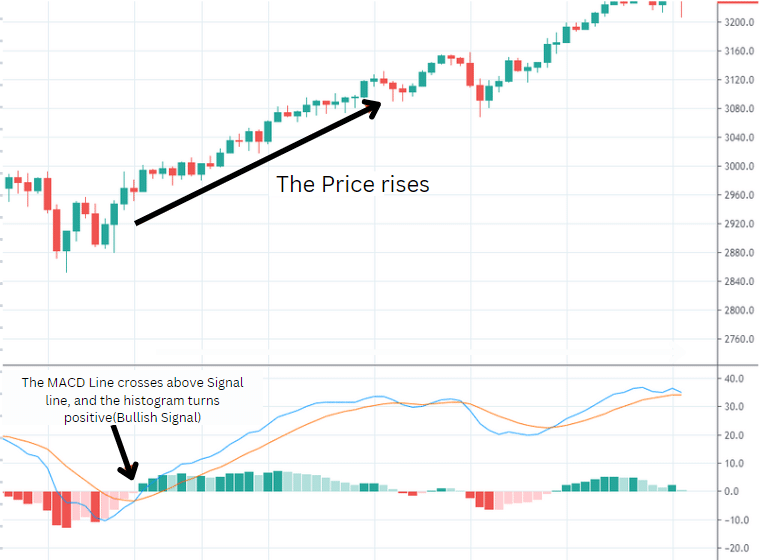
Buy when the MACD Line crosses above the Signal Line (in histogram terms, buy when the MACD histogram surges above 0 and becomes positive).
Sell when the MACD Line crosses below the Signal Line or basically, sell when the MACD histogram falls below 0 and turns negative.
The strategy is based on the observation that markets often "roll over" at peaks and "roll up" at troughs. Consequently, market tops are frequently characterized by diminishing momentum.
Given that the MACD indicator is designed to signal weakening momentum, it can be an effective tool for anticipating market tops and bottoms.
Keep in mind that this strategy works best in clearly identified trends.
Here's an example of a bullish trade using MACD crossovers:
2. MACD divergence for predicting turning points
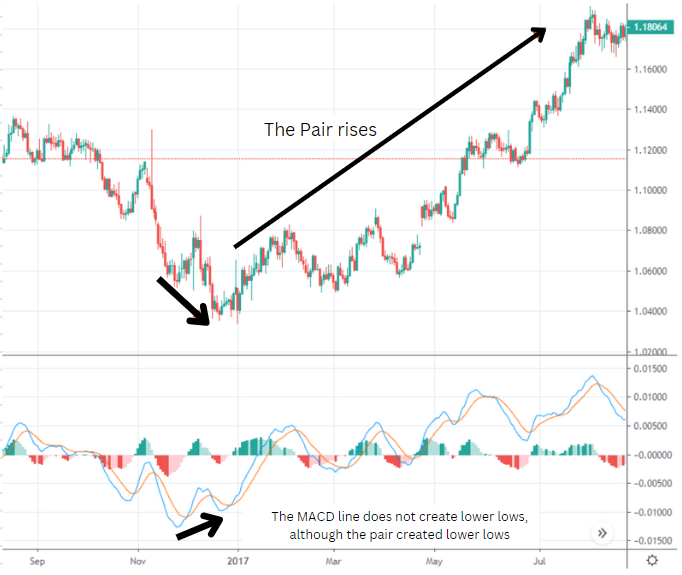
Divergence is when the price of a security or asset is moving in the opposite direction of an indicator, indicating that the current price trend is getting weaker.
Retail traders, use the MACD divergences to assist in predicting the peaks and bottoms of the markets. However, the issue with strategies that rely on ''divergence'' is the extreme difficulty of quantifying divergence.
Like all other humans, the trader's brain tends to interpret information in a way that aligns with its existing beliefs, leading the eye to see whatever it wants on the charts.
So if a trader is already inclined bearish, he can always spot a ''Bearish MACD divergence'' to justify his existing belief, and it goes both ways.
As mentioned before, the divergences are very complex to quantify making it difficult to predict market tops or bottoms.
3. MACD Histogram analysis
The MACD histogram represents the difference or spread between the MACD line and the signal line. it oscillates in the region of the zero line (can go above or below), providing insights about the momentum of the market, and hinting at potential reversals.
The MACD histogram can be used in several ways to fit your trading strategy.
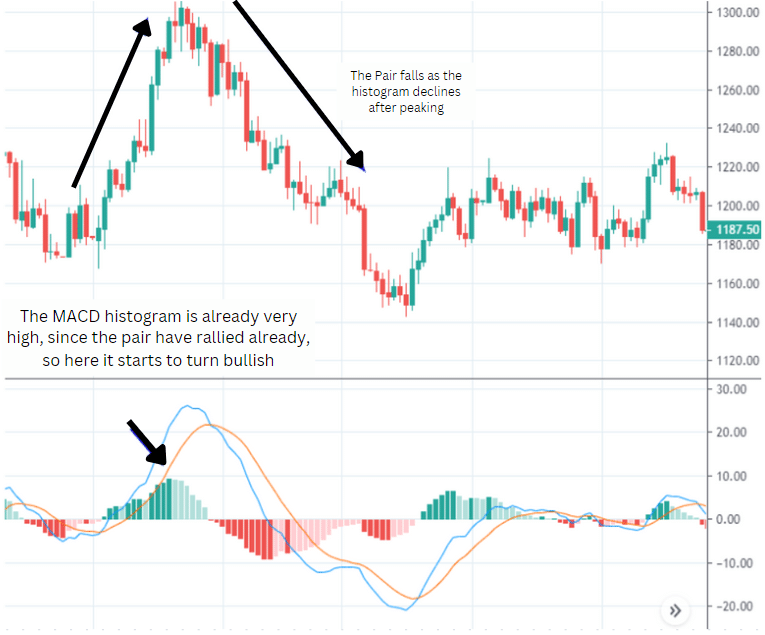
1. Zero Line Cross
This strategy is mainly about using the zero line, as we discussed before, the histogram can oscillate above or below the zero line.
For instance, when the histogram moves above the zero line, it signifies that the MACD line has crossed over the signal line, implying growing bullish momentum and potentially signaling a buying opportunity.
Conversely, when the histogram drops below the zero line, it indicates that the MACD line has crossed below the signal line, suggesting increasing bearish momentum and possibly signaling a sell opportunity.
2. Histogram Peaks and Troughs
When the histogram reaches a peak and starts to decline, it indicates that the bullish momentum is fading and bears are starting to take control. If the price is still rising, this divergence can be an early warning of a potential reversal.
When the histogram reaches a trough and starts to rise, it indicates that bearish momentum is decreasing. If the price is still falling, this divergence can signal a potential bottom and upcoming reversal.
3. Histogram Divergence
Occurs when the price makes a lower low, but the histogram makes a higher low. This indicates that the selling pressure is weakening, suggesting a potential reversal to the upside.
Whereas, when the price makes a higher high, the histogram makes a lower high. This signals that buying pressure is weakening, suggesting a potential reversal to the downside.
4. MACD trend filtering
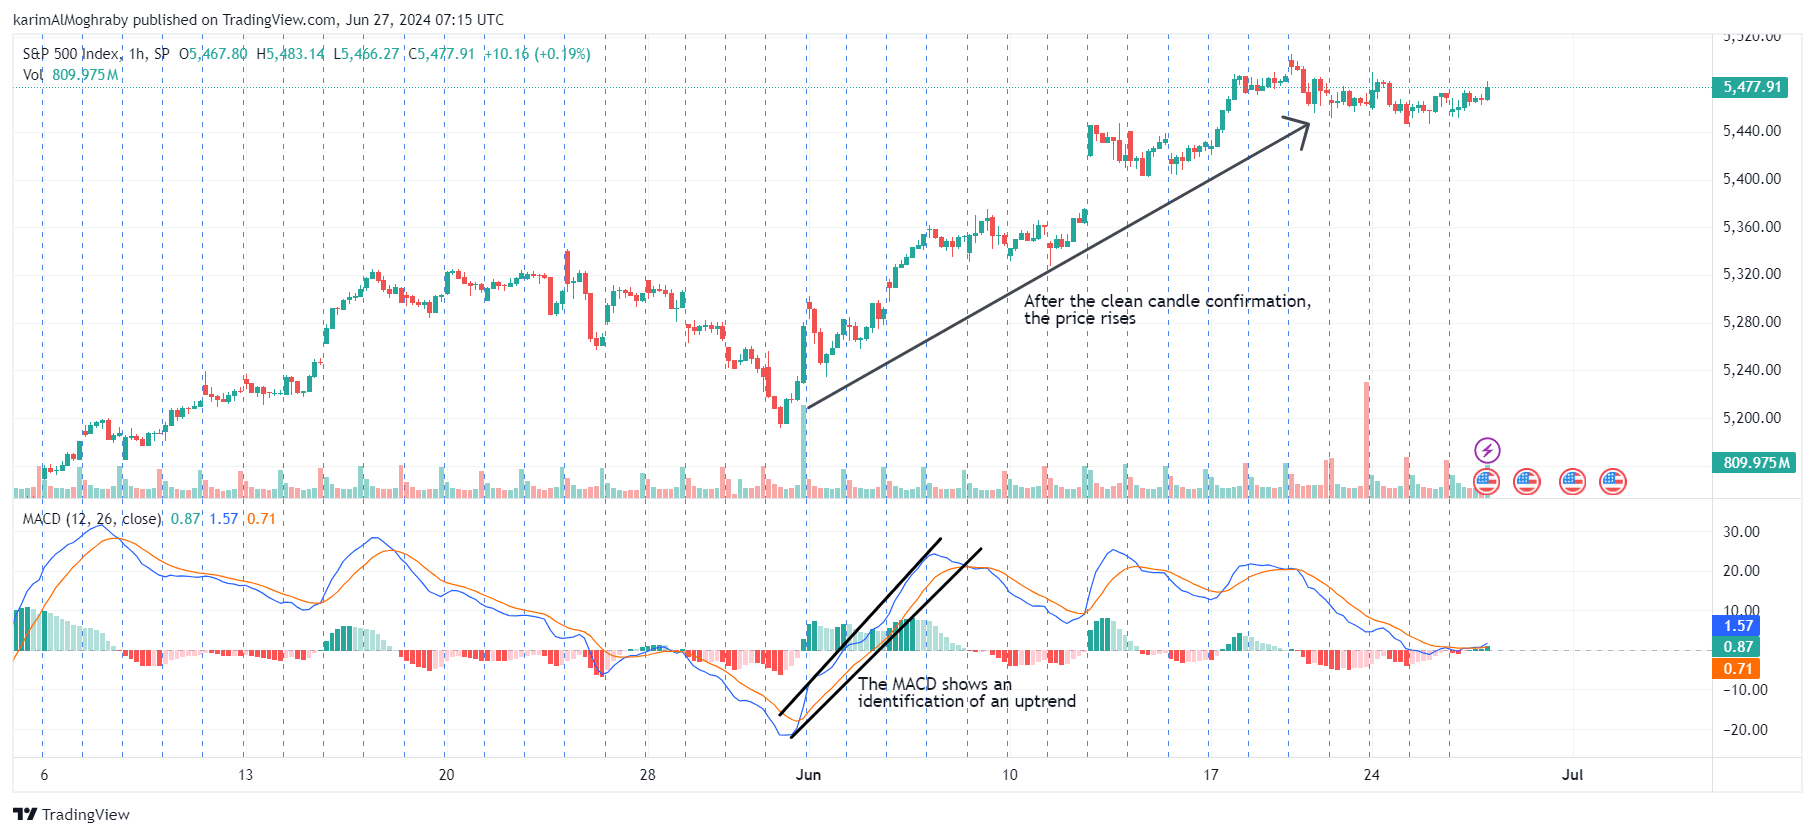
We keep stressing the fact that you have to trade with the market. This implies that you have to look for bullish entries when the market is bullish and bearish entries when the market is in a downtrend.
Here comes the MACD trend filtering strategy in action to help us indicate the actual market trend direction, and not get fooled by fake trends.
First, decide on the time frame for your trades, whether it's hourly, daily, weekly, or another period.
Then, apply the MACD to a higher time frame. For example, if you're considering trades based on a daily chart, examine the MACD histogram on a weekly chart.
If the MACD histogram on the higher time frame is positive, focus on looking for long trades.
If the MACD histogram on the higher time frame is negative, focus on looking for short trades.
The four MACD strategies mentioned are widely known and can be found across numerous resources. However, most sources tend to emphasize instances where MACD proves effective rather than addressing its limitations.
This often leaves novice traders puzzled when they encounter less-than-expected results, questioning why an allegedly powerful indicator falls short.
Before delving into MACD's effectiveness and discussing strategies for improvement—without glossing over failures like many promotional materials—let's consider reasons why MACD may not always perform as expected.
It's important to understand that no trading indicator is infallible; our goal is to identify tools that perform better than random chance.
The four MACD strategies we already mentioned are well-known and widely discussed in numerous trading resources. However, these sources often focus on the scenarios where MACD performs well and results in profit for the trader, neglecting the instances where it fails.
This leads many new traders to wonder why their results aren't consistently satisfying despite being told that the MACD trading strategy is highly effective. They find themselves questioning their trading journey and if indicators do work or if they are the equivalent of astrology in financial markets.
Before we discuss how well MACD performs—without glossing over failures as many financial marketers do—it's important to understand why MACD might not work in certain situations.
We have to highlight that no indicator works all the time or results in a 100% win rate, or else everyone would be rich already.
Questioning The MACD's Reliability
Buy and sell crossovers
In this strategy, the trader aims to become bearish when the market's upward momentum weakens and to shift to a bullish stance when signs of weakening downward momentum emerge.
However, this presents a critical problem:
Just because the market's bullish momentum is weakening, doesn't mean that the uptrend will end and the bulls will stop pushing the stock price higher. The same goes the opposite way, if the market's downward momentum is weakening, the bears might be pausing before pushing the stock price lower.
MACD divergence for predicting turning points
Traders might use MACD divergences to help predict the tops and bottoms of a market.
Trading strategies that rely on the concept of divergence might fool the trader by what he wants the market to do instead of what is occurring If he is already inclined to be bearish, he can always spot a "bearish MACD divergence" to justify his bearish stance.
Moreover, many divergences aren't able to predict market tops or bottoms.
MACD Histogram Readings
Traders using this strategy will turn bullish when the MACD histogram is extremely low and turn bearish when the MACD histogram is very high.
This presents a problem as well:
"Extreme" levels can become even more extreme.
A very high MACD histogram does not eliminate the possibility of the market continuing to rally and pushing the histogram even higher. Conversely, a very low MACD histogram does not rule out the market continuing to decline and pushing the histogram lower.
Additionally, because the MACD histogram uses nominal values, peaks tend to get higher and troughs lower over extended periods.
To ensure that long-term comparisons are accurate, it's essential to normalize the MACD histogram by dividing it by the market's value, allowing for consistent comparisons across different periods and timeframes.
MACD Trend Filtering
This MACD strategy is the least skeptical, it has been proven to work by historical data several times.
The skepticism here lies in questioning whether the MACD is genuinely better than a simple moving average as a trend filter for the market noise. Is the MACD with the best settings truly more effective at keeping traders on the right side of the market?
For instance, if you pursued bullish trades when the market was above its 200-day moving average and bearish trades when it was below, the results might be no worse than if you based your trades on a positive or negative MACD histogram.
Having examined the potential issues with different MACD trading strategies, it’s crucial to focus on empirical data and facts rather than relying on advice from trading gurus or books. These sources often aim to sell you "the secret" or the ''best MACD settings'' by highlighting the brilliance of their tactics.
As a trader, your responsibility is to stay objective and grounded in the reality of market behavior and make informed trading decisions.
Combining the MACD with other technical analysis tools
It is essential to combine the MACD oscillator with other technical analysis tools, as the MACD alone is not as effective. For example, the best Macd settings for 5 minute chart can significantly enhance the reliability of your trading signals when the MACD is paired with RSI, moving averages, or volume indicators.
MACD and Moving Averages
Using the MACD oscillator in parallel with moving averages can reinforce trend signals, providing clearer buy and sell signals.
Steps to combine MACD with simple moving averages (SMAs):
Set the MACD with standard settings (12, 26, 9).
Overlay a 50-period SMA on the same chart to identify the trending markets.
Enter trades when MACD crosses its signal line in the direction of the broader trend indicated by the SMA.
This is the recommended MACD setting for day trading when you want to use the oscillator in conjunction with moving averages.
Using MACD With Volume Indicators
Volume indicators can be used together with MACD signals by confirming the strength behind price movements, to provide a more solid foundation for trades.
Traders usually suggest these volume indicators that work well with MACD.
On-Balance-Volume (OBV) and the Volume Oscillator. These tools are complementary to enhance the reliability of the bullish and bearish trend signals.
Synergy With Fibonacci Retracement Levels
Fibonacci retracement levels provide key price targets and potential reversal points. When combined with the MACD, they can help identify better market entries and exits.
Identify a Major Price Move: Apply Fibonacci retracement levels to a significant price movement.
Confirm with MACD: Look for MACD to signal a reversal near key Fibonacci levels, such as 38.2%, 50%, or 61.8%.
Recognizing False Signals During High Volatility
MACD signals can often generate false alarms in volatile markets. To filter out these misleading signals, you can use volatility indicators like Bollinger Bands or the Average True Range (ATR).
Instead of acting immediately on a MACD crossover, wait for additional confirmation. This could involve waiting for another candlestick pattern to close or for other technical indicators to align.
Always employ risk management techniques, such as setting stop-loss orders, to protect against sudden market moves. This is particularly crucial in volatile conditions where the market can quickly move against your position.
Key Takeaways
Best MACD Settings: these are the ones that work best for you, customize MACD parameters (e.g., EMAs, signal line) to fit your trading style and market conditions.
Signal Validation: Combine MACD signals with other indicators to confirm your trading decisions.
Risk Management: Use stop-loss orders and volatility indicators to mitigate risks associated with false signals, especially during periods of high market volatility.
Continuous Adaptation: Stay flexible and adapt MACD strategies based on evolving market trends and dynamics to maintain trading edge.
Balanced Approach: Avoid over-reliance on MACD alone and integrate it into a comprehensive trading strategy that includes multiple technical and fundamental indicators.
Conclusion
Mastering the MACD and optimizing its settings enhances traders' ability to analyze market trends, momentum shifts, and potential reversals effectively. While the MACD offers versatile tools like crossovers, divergence detection, histogram analysis, and trend filtering, caution is advised against over-optimization.
Understanding the MACD and optimizing its settings helps the trader analyze the markets on a wider scope. Although the MACD offers versatile tools, caution is always advised against over-optimization of your strategy.
The "best" MACD setting varies across markets and timeframes, with historical performance not guaranteeing future success. Supplementing MACD signals with moving averages, volume analysis, and Fibonacci retracement levels improves reliability.
Recognizing limitations such as false signals during high volatility underscores the need for disciplined risk management.
MACD remains a valuable tool but requires continuous adaptation, thorough analysis, and decision-making to navigate dynamic market conditions and achieve consistent trading outcomes in volatile markets.
Take Your Trading to Next Level
Take Your Trading to Next Level
You Might Also Like:


