We hope you enjoy reading this blog post.
Become a Pro Trader by using our fine-tuned Indicators and Expert Advisors.
7 MACD Crossover Strategies for Forex Trading

In the realm of Financial Markets, technical analysis has been suggested to have a major role. Several technical tools have been widely used and known to be effective by the community including the MACD indicator that was originally developed by Gerald Appel.
The MACD is known for providing insights into momentum shifts, and potential trend reversals and signaling strategic entry and exit points in financial markets.
In this article, we will explore the fundamentals of the MACD indicator and the best 7 MACD crossover strategies, or what our team likes to call ''The 7 Crossover Wonders''. Each strategy offers a unique perspective on harnessing the power of MACD for improved trading outcomes.
Whether you are a new trader looking to grasp the basics or a seasoned investor seeking to refine your trading strategy, mastering these MACD crossover strategies can elevate your ability to identify optimal entry and exit points with confidence.
What is The MACD Indicator
MACD is a well-known momentum oscillator that indicates the relationship between two Exponential Moving Averages (EMAs) concerning an asset's price. The trend-following indicator consists of three main components, a histogram, a signal line, and an MACD line.
When combined they provide valuable information about the overall market momentum, trend, and if any potential reversals are about to occur. It’s not just about price changes on the chart, it is more about exploring the underlying strength or weakness in the market to make informed trading decisions.
The nine-day Exponential Moving Average of the MACD known as the ''signal line'' is placed above the MACD line, which some traders suggest that it functions as a trigger signal to buy or sell.
Whereas, the MACD line is calculated by subtracting the 26-period Exponential Moving Average (EMA) from the 12-period EMA. (MACD= 26EMA –12EMA).
Theoretically, the MACD line ranges above or below the zero level and moves in tandem with the signal line.
The MACD histogram is a visual representation of the MACD Line−Signal Line, and the Zero Line is a horizontal line that separates the positive and negative territories of the histogram.
The 7 MACD Crossover Strategies
Now that we understand exactly how to read the MACD, let’s walk through a few different ways that it can be used to make a trading decision and harness the power this oscillator provides.
Disclaimer: the EMA settings we mention in this article are based on the default MACD parameters provided by most charting platforms 12,26,9. For optimal performance, we suggest customizing the MACD settings to match the specific instrument and timeframe you're trading.
Strategy 1: Signal Line Crossover
The signal line crossover strategy is one of the most common strategies for using the MACD indicator, where the crossover occurs between the MACD line (Difference between 12-period EMA and 26-EMA) and the signal line which is the 9-period EMA of the MACD.
This crossover indicates changes in the market momentum and the chance of a potential trading opportunity.
A Bullish crossover occurs when the MACD line crosses above the signal line, suggesting an upward momentum in the underlying asset's price. It is often interpreted as a buy signal because the asset may be entering a new uptrend.
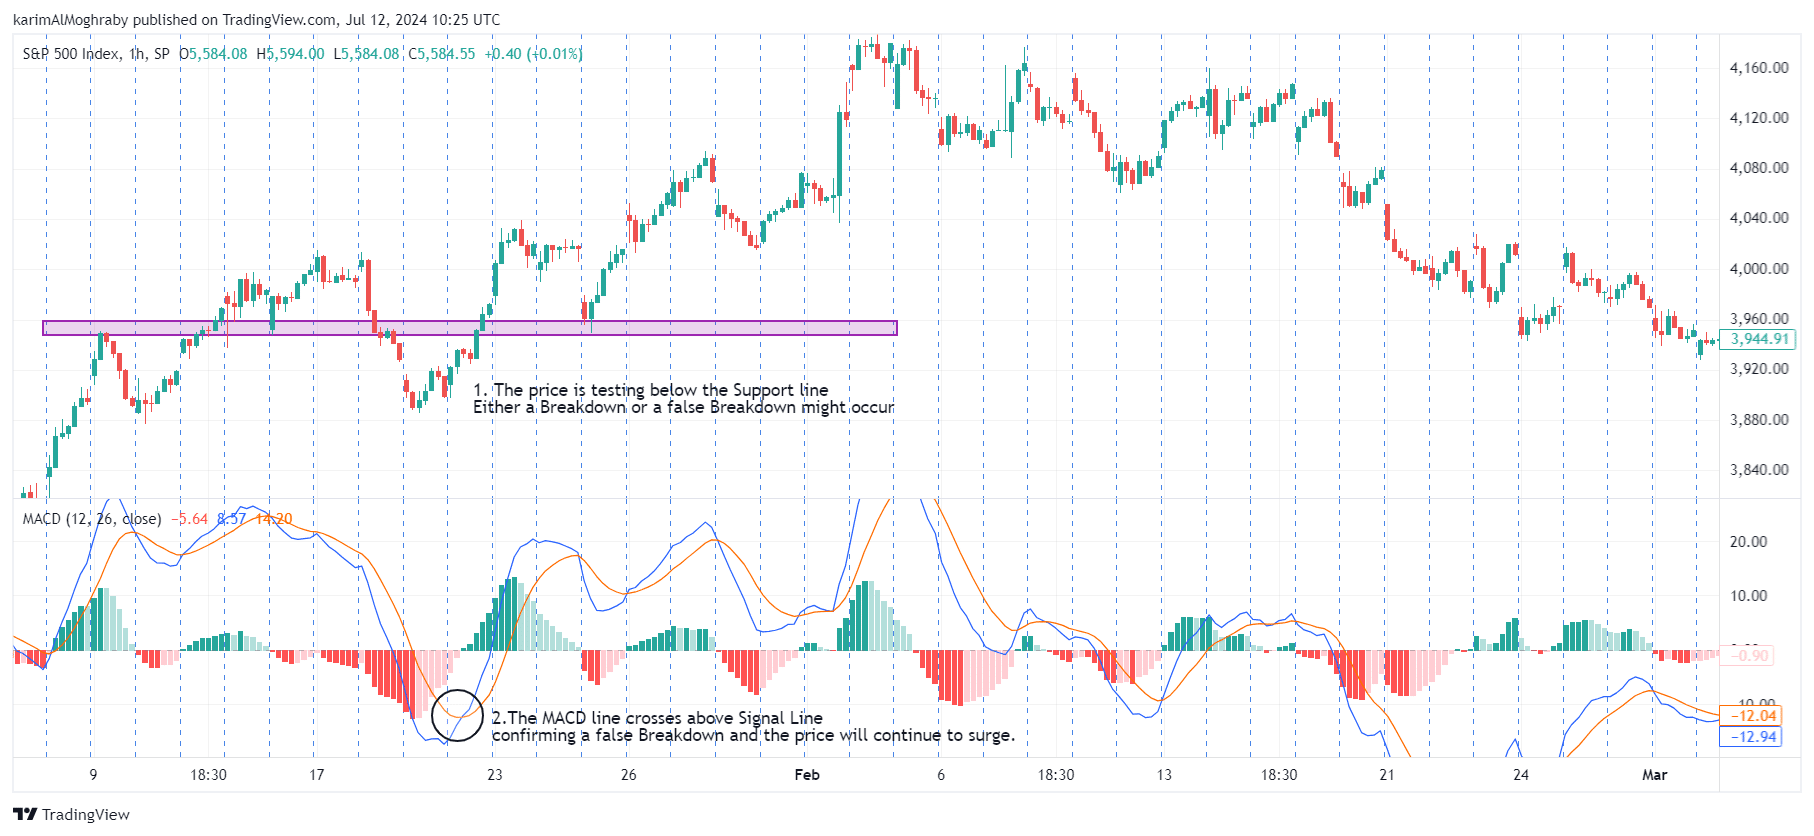
Whereas, a bearish crossover occurs when the MACD line crosses below the signal line, indicating that the momentum is starting to cool down and a downtrend is about to occur. It is often viewed as a sell signal or a signal to short the asset.
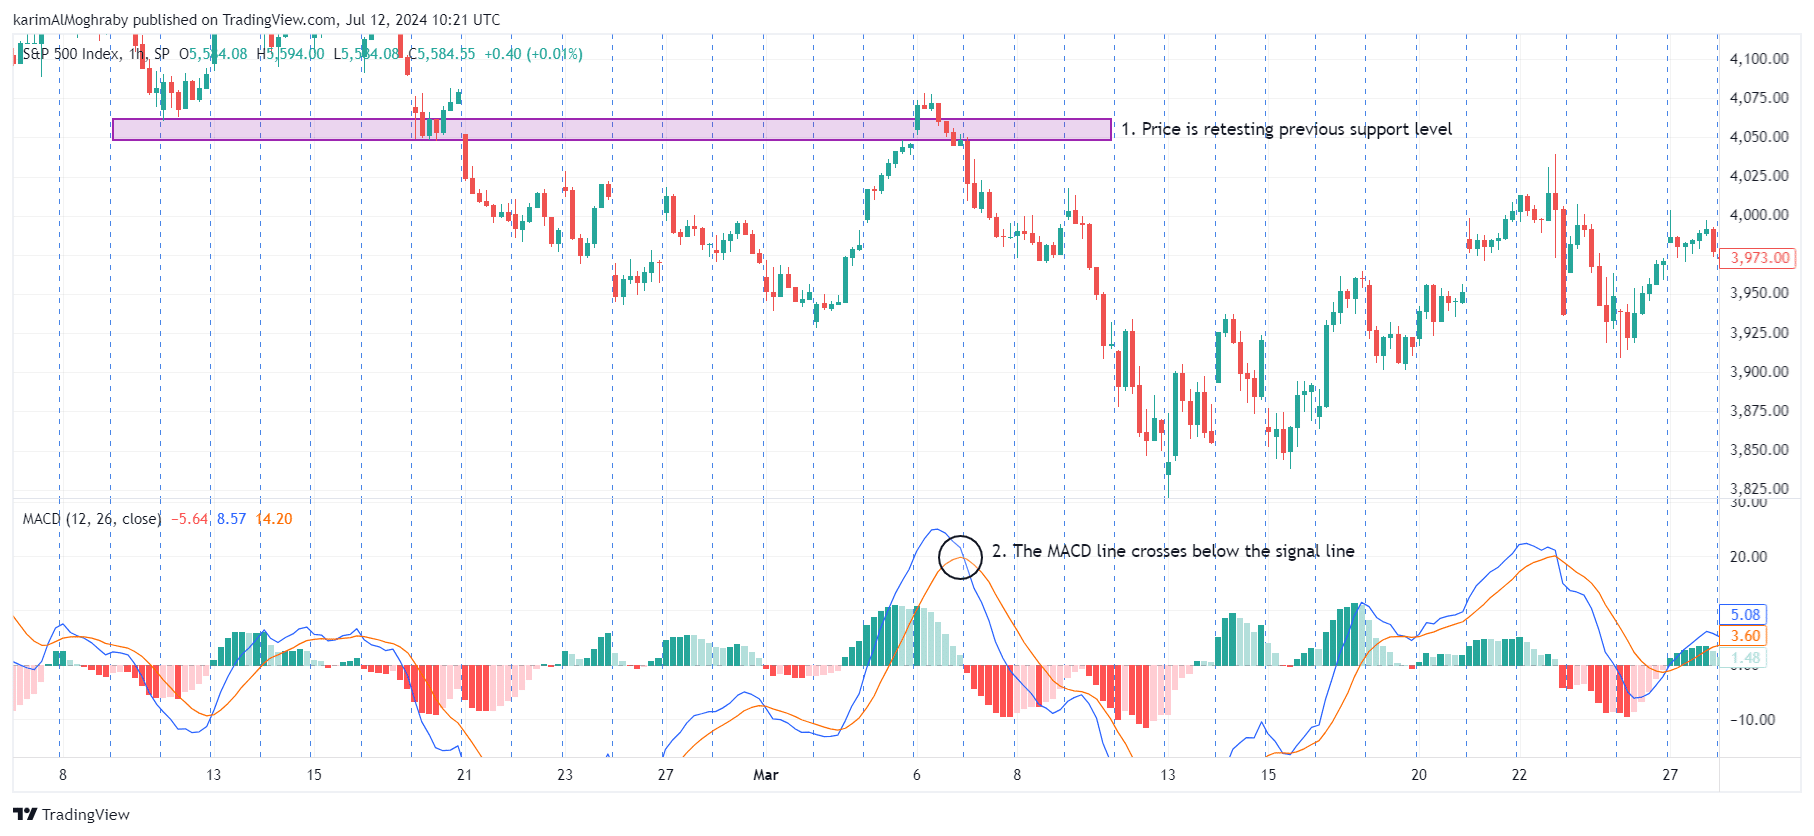
Strategy 2: Zero Line Crossover
The Zero Line Crossover strategy is a staple in the toolkit of many traders that offers a reliable way to identify potential trend reversals and confirm the market's direction. This strategy revolves around the MACD line crossing the zero line.
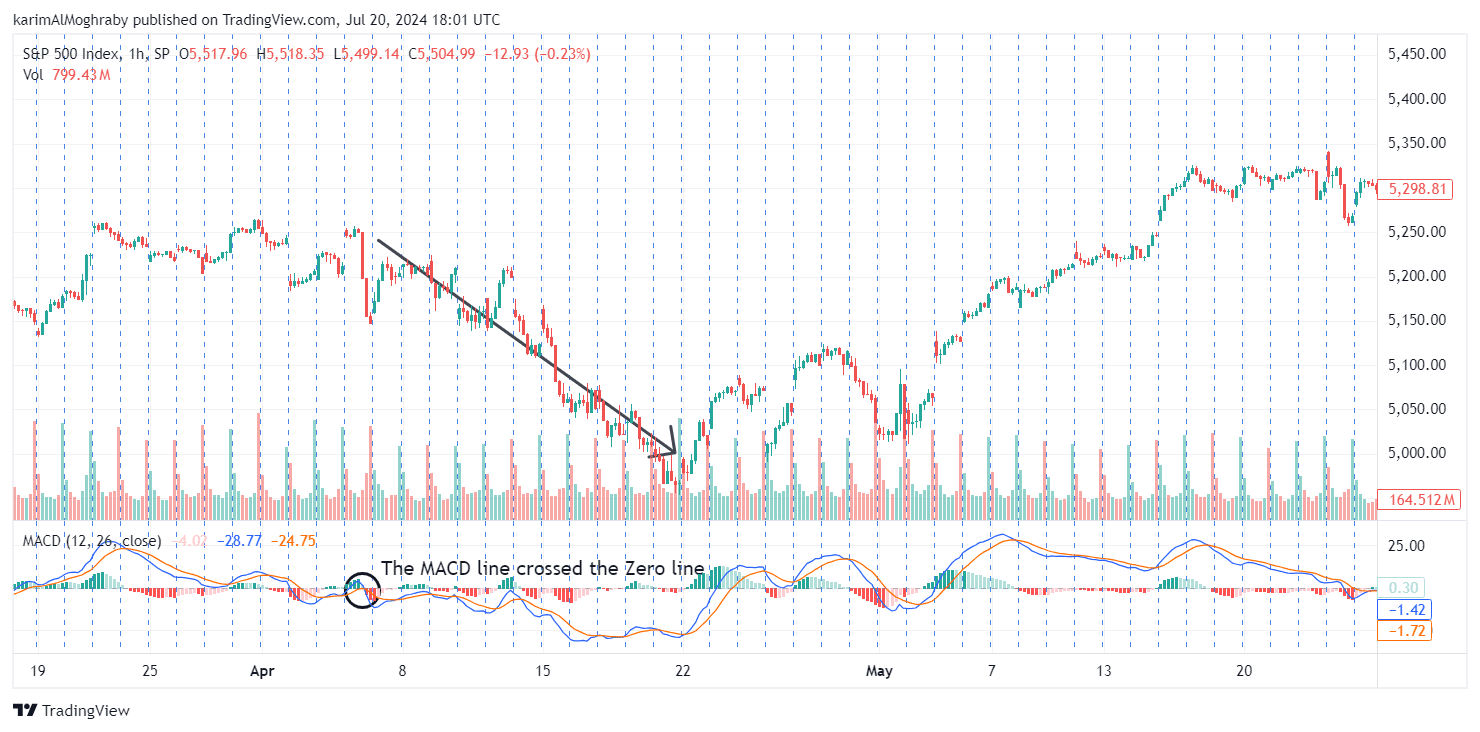
The Zero Line Crossover occurs at its core when the MACD crossovers the zero line on the MACD histogram. This crossover is a significant moment that traders wait for as it signals a shift in market momentum and assists speculators in confirming the direction and strength of a trend.
A Bullish Zero Line crossover takes place when the MACD line crosses above the zero line. This signals that short-term momentum is shifting upwards, indicating the start of a new uptrend as bulls are starting to take control.
Traders often interpret this as a buy signal, as it suggests the asset is gaining an upward momentum.
On the other hand, A Bearish Zero Line crossover happens when the MACD line moves below the zero line. This signals that short-term momentum is shifting downwards and the underlying asset's sell volume is increasing, suggesting the beginning of a new downtrend.
Strategy 3: The MACD Triple Crossover Strategy
The MACD Triple Crossover trading strategy is an advanced approach that combines the MACD line, the signal line, and a long-term moving average.
This helps provide more robust and accurate buy and sell signals by filtering out the noise using the long-term MA and confirming the trend direction with additional layers of verification.
The Triple Crossover strategy leverages three key components:
- MACD Line
- Signal Line
- Long-Term Moving Average: Typically a 50-period or 200-period simple moving average (SMA), helps identify the overall trend direction.
A Bullish MACD crossover is indicated when both the signal line and the MACD line cross above the long-term moving average.
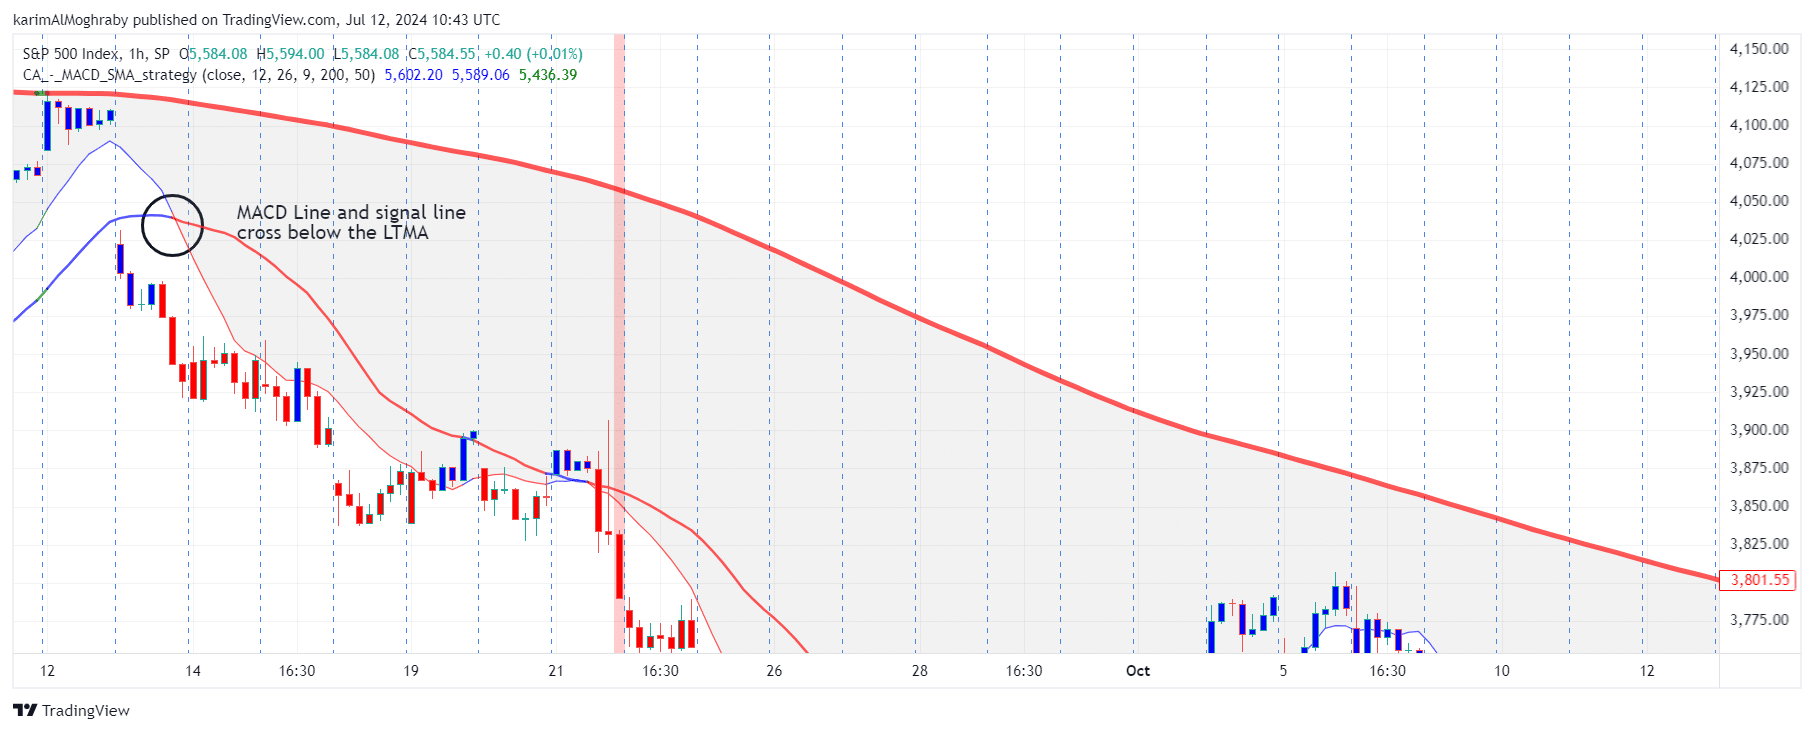
Whereas a bearish crossover is spotted when both the MACD line and the signal line cross below the long-term moving average.
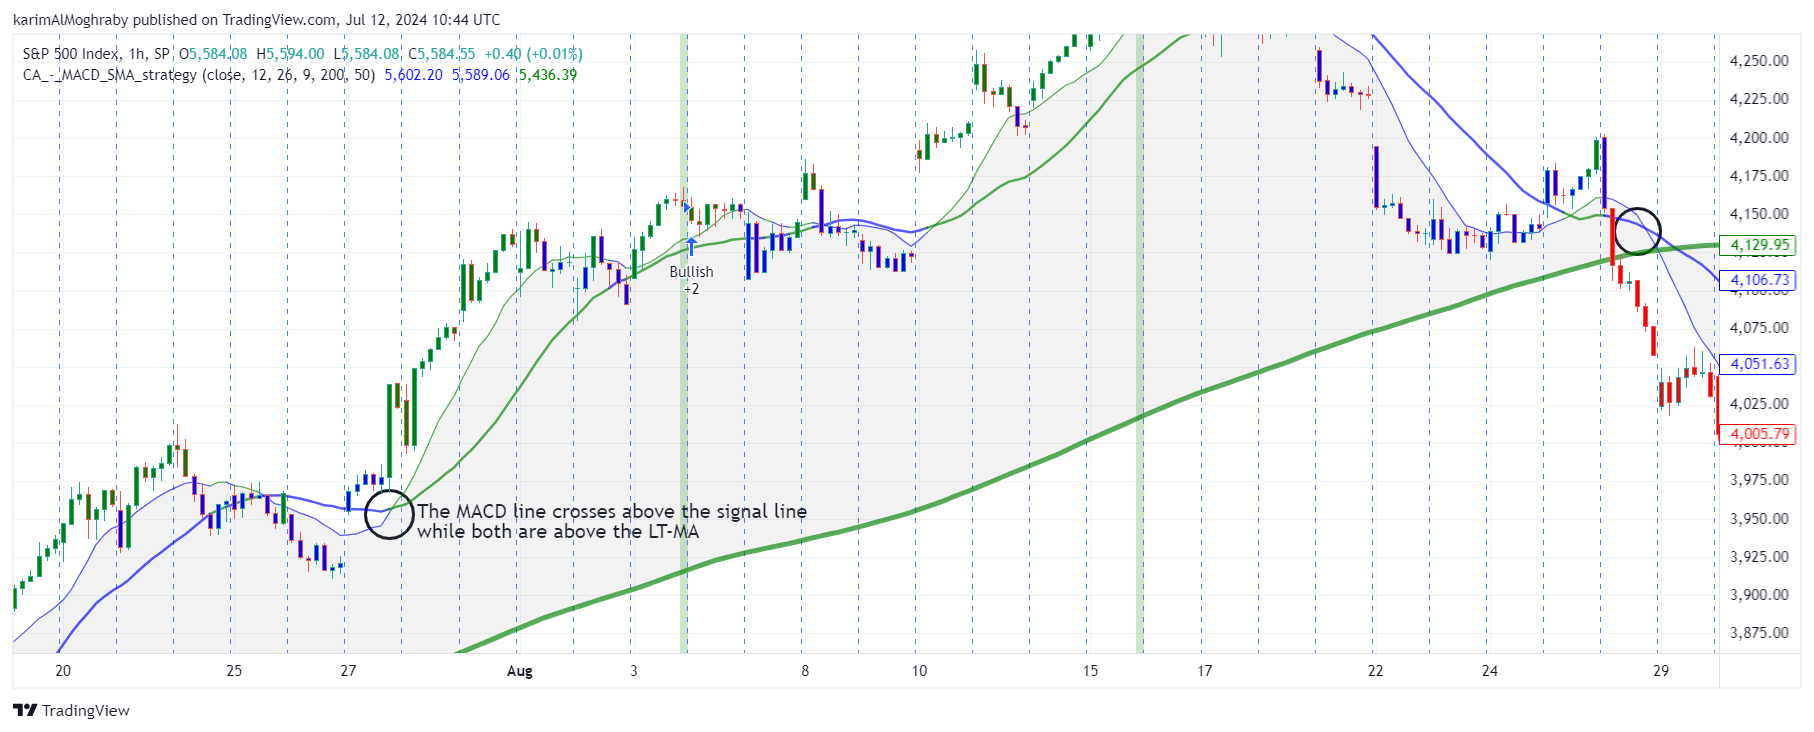
This strategy involves looking for instances where both the MACD line and the signal line cross the long-term moving average, providing a more reliable indication of trend changes.
Strategy 4: Moving Average Crossover Confirmation
The Moving Average Crossover Confirmation strategy is a nuanced approach that combines the power of MACD signals with the validation of moving average crossovers. This dual-layer strategy aims to provide more reliable entry and exit points by confirming MACD signals with additional moving average data.
This strategy hinges on two main components:
- MACD Crossovers: The traditional MACD line crosses the signal line.
- Moving Average Crossovers: The crossover between Long-term MA and Short-term MA.
A bullish confirmation occurs when a bullish MACD crossover (MACD line crossing above the signal line) coincides with the short-term moving average crossing above the long-term moving average.
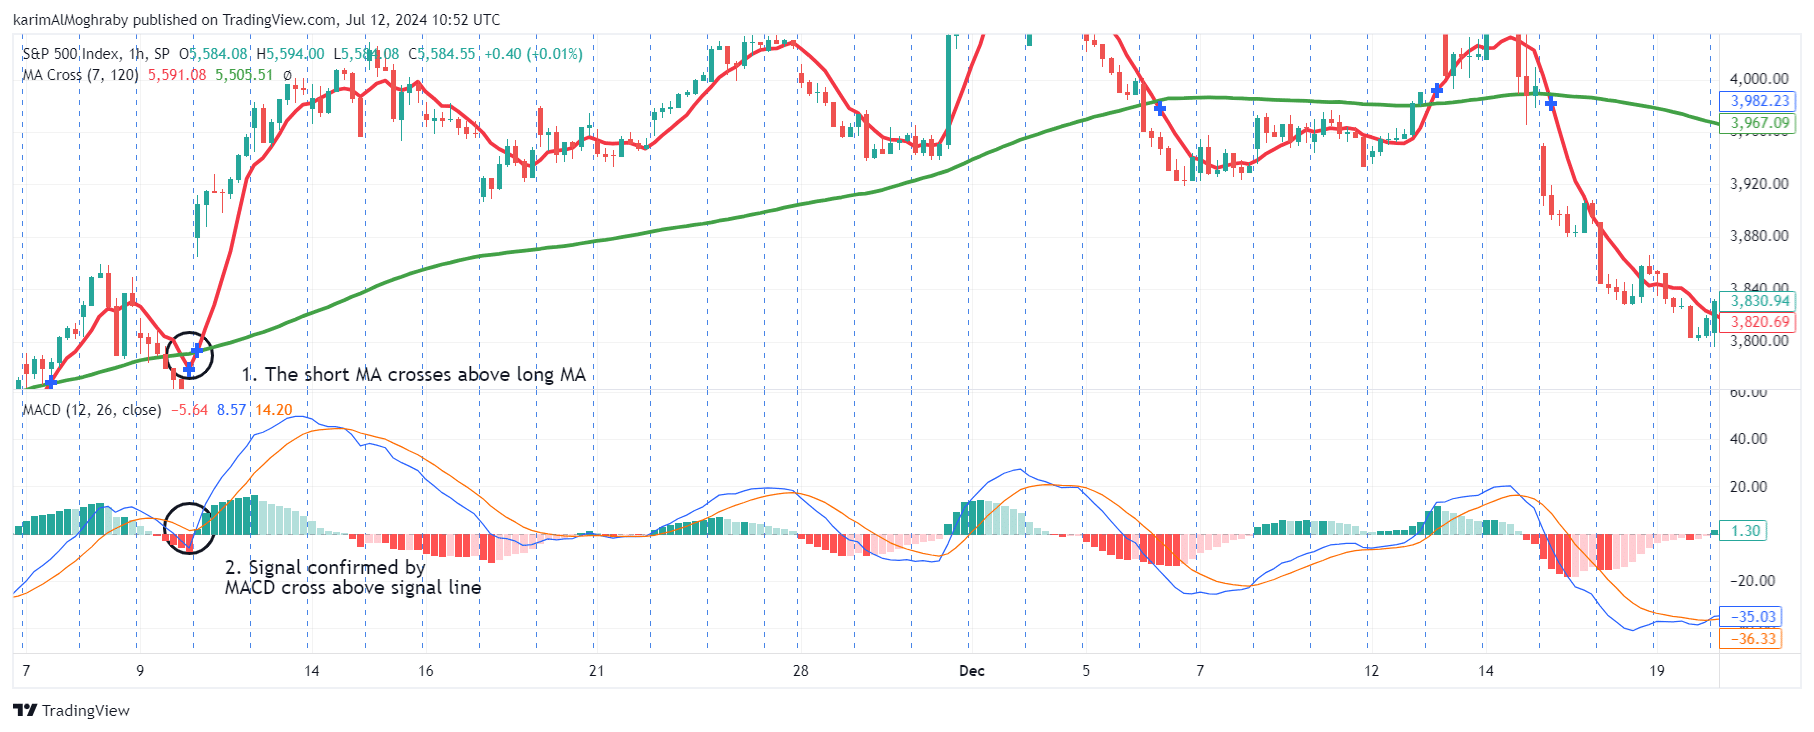
A bearish signal occurs when a bearish MACD crossover (MACD line crossing below the signal line) coincides with the short-term moving average crossing below the long-term moving average.

Every trading strategy has its cons, the Moving Average Crossover Confirmation might be still subject to lag, as it relies on past price movements and the trader might miss early trend reversals due to the need for dual confirmation.
Strategy 5: MACD Histogram Reversals
The MACD Histogram Reversal strategy focuses on identifying potential trend reversals by analyzing the behavior of the MACD histogram.
The histogram, which represents the difference between the MACD line and the signal line, provides a visual representation of the momentum in the market just like the volume indicator. Traders can observe the changes in the histogram and anticipate momentum shifts to make more informed trading decisions.
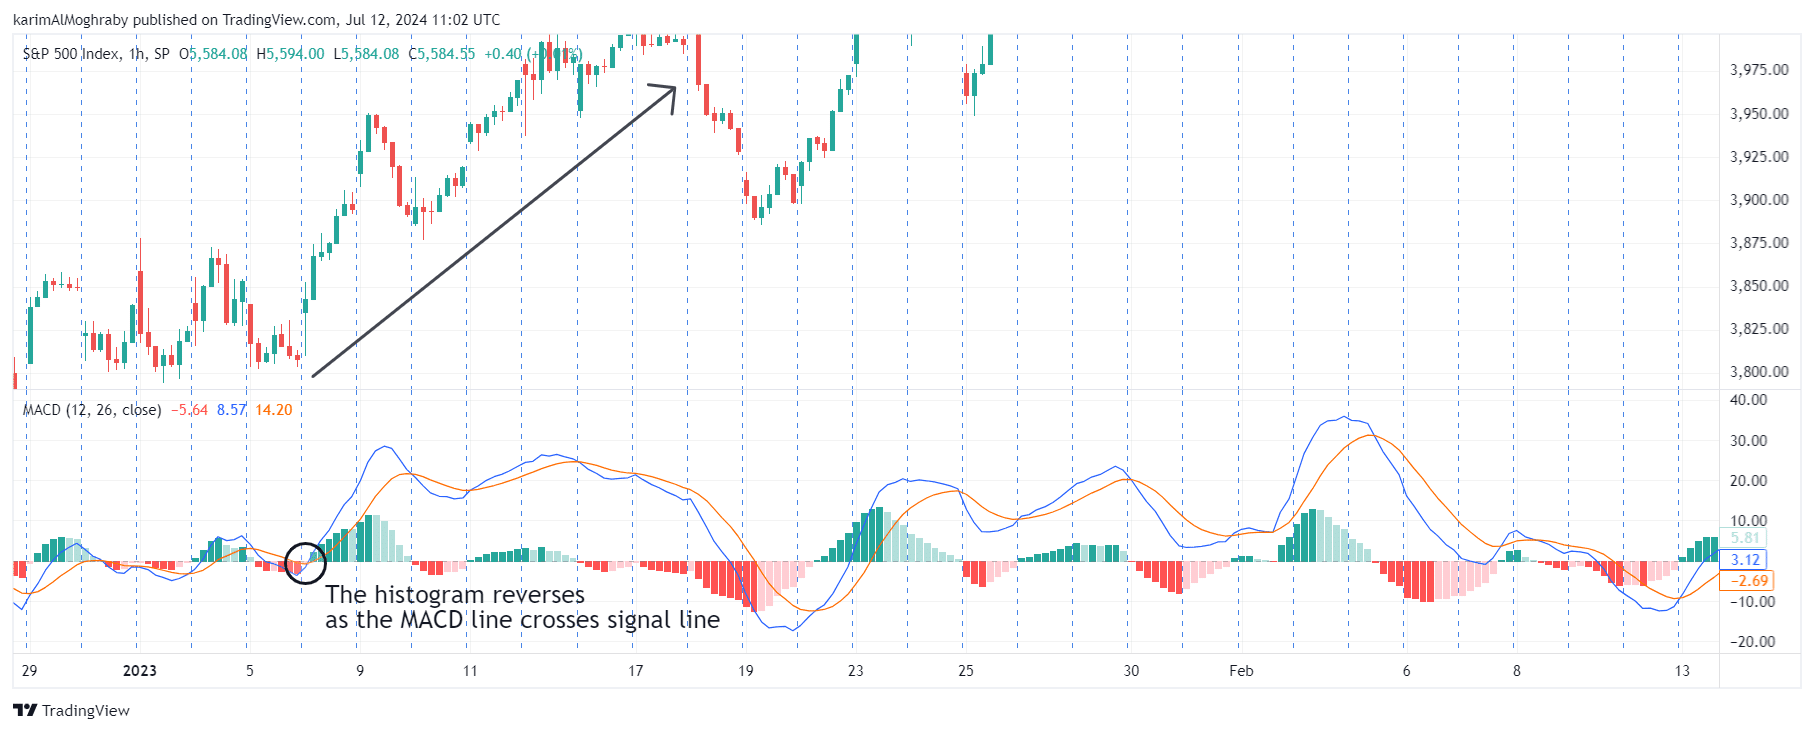
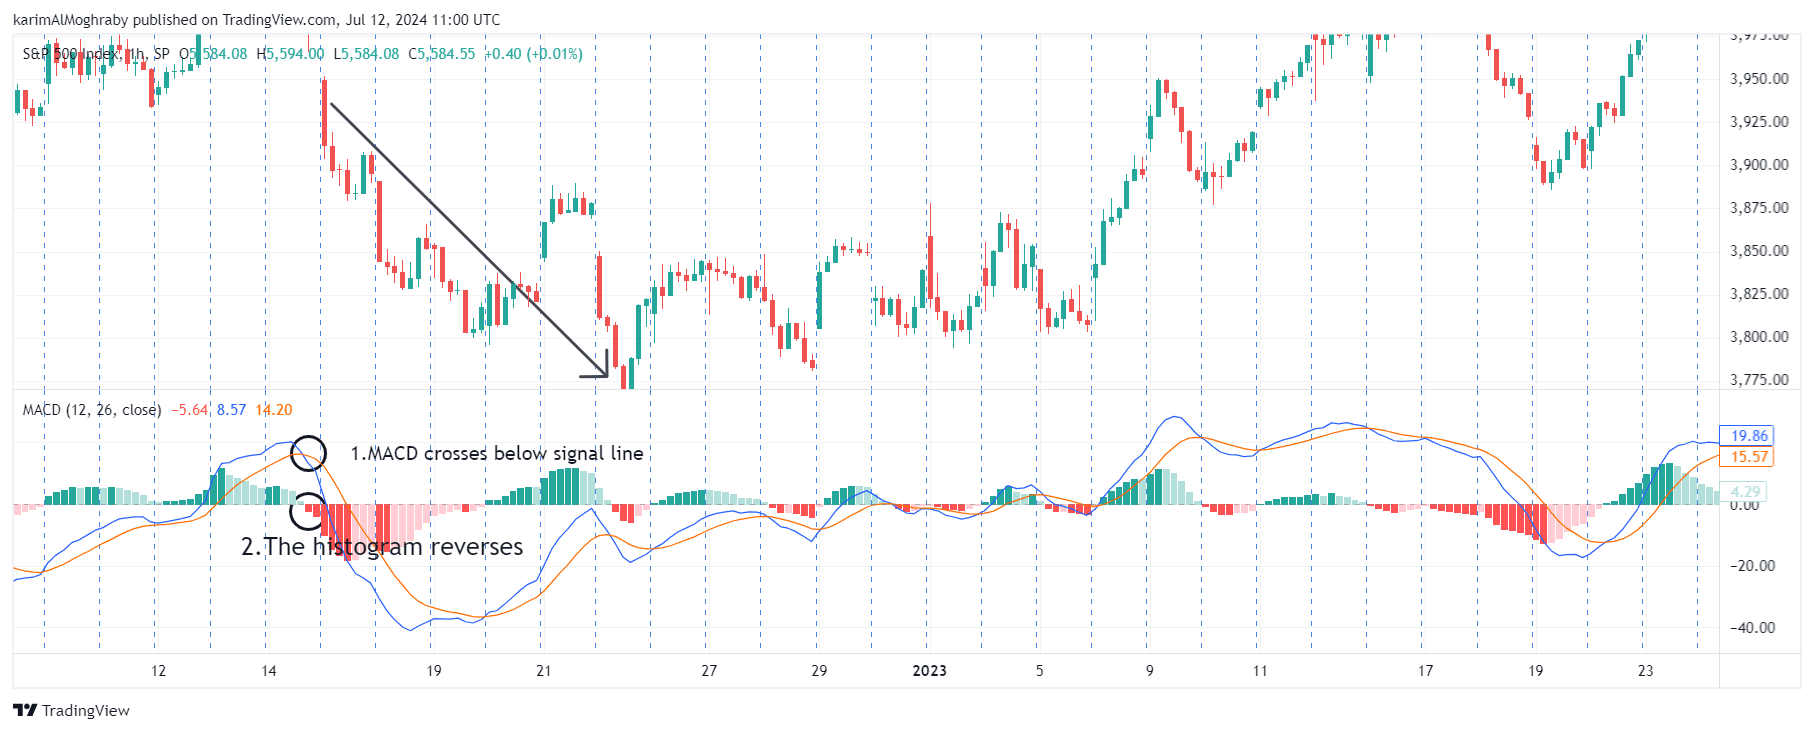
When the MACD histogram moves from negative to positive, it indicates that the MACD line has crossed above the signal line. Often considered by traders as a bullish crossover and serves as an early indicator of a potential uptrend.

A bearish reversal occurs when the MACD histogram moves from positive to negative. This shift indicates that the MACD line has crossed below the signal line, suggesting that downward momentum is increasing. It serves as an early indicator of a potential downtrend.
Strategy 6: MACD and RSI Crossover Strategy
This strategy combines two powerful technical oscillators to enhance trading signals and confirm entry and exit points in the market.
By leveraging both the MACD indicator, which identifies trends and momentum shifts, and the RSI indicator, which measures the speed and change of price movements and overbought/oversold market conditions.
By combining MACD with RSI, traders can effectively spot trends and momentum shifts, measure the speed and price movement changes, and identify overbought or oversold market conditions.
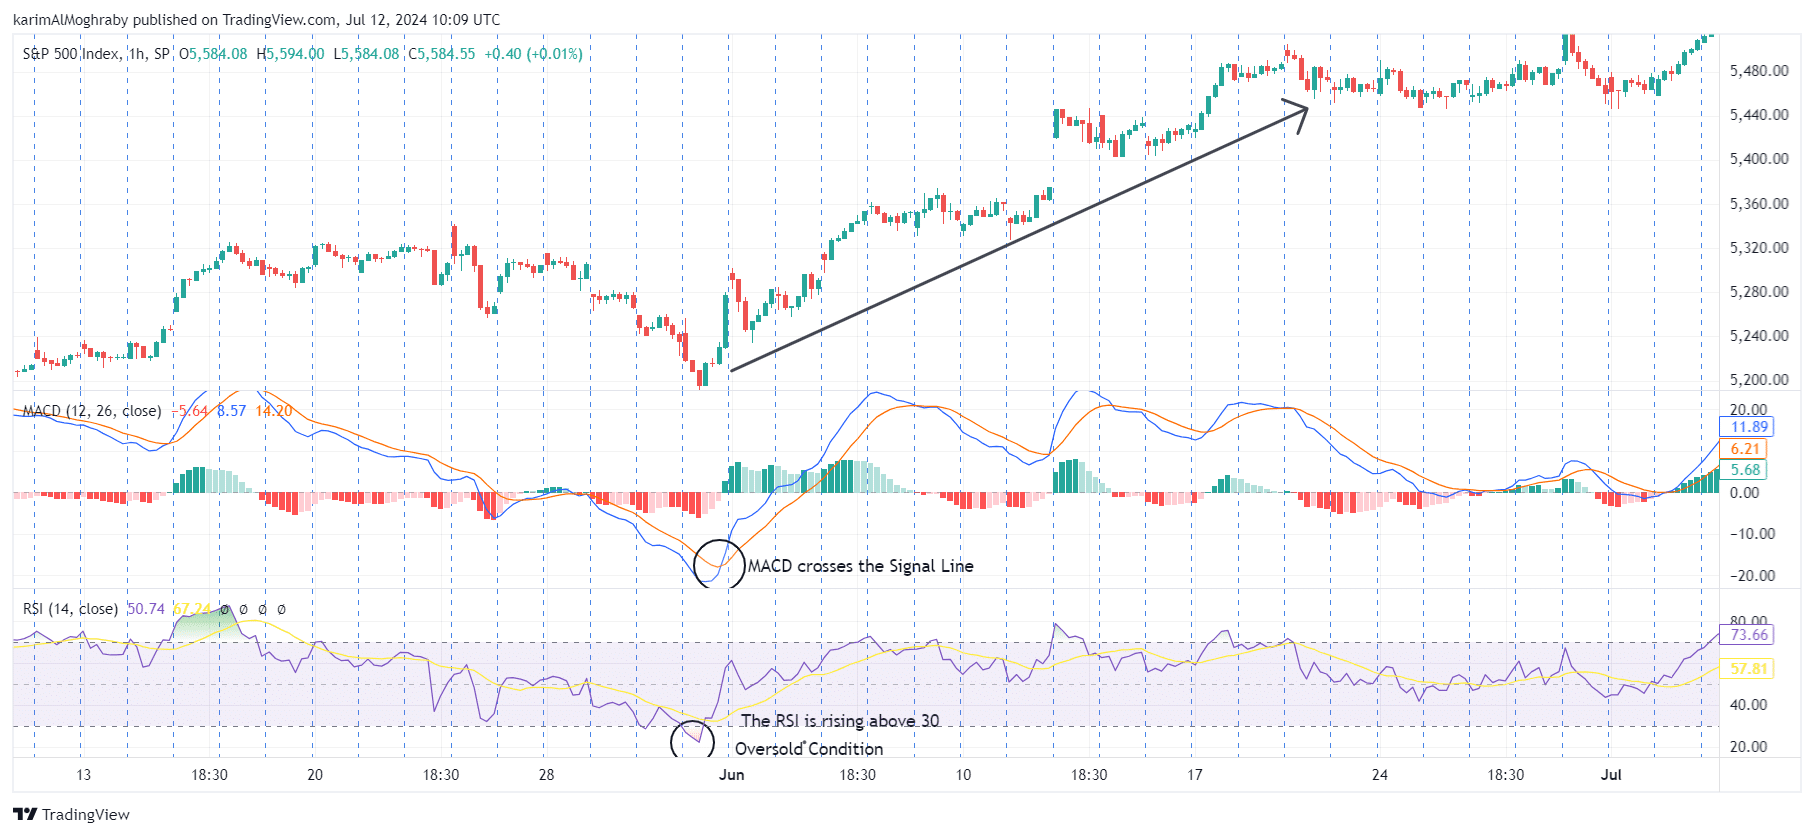
A bullish MACD crossover occurs when the MACD line crosses above the signal line, indicating potential upward momentum. This bullish crossover is strengthened if the RSI moves above the 30 level, suggesting that the asset was previously oversold and is now potentially reversing to the upside.
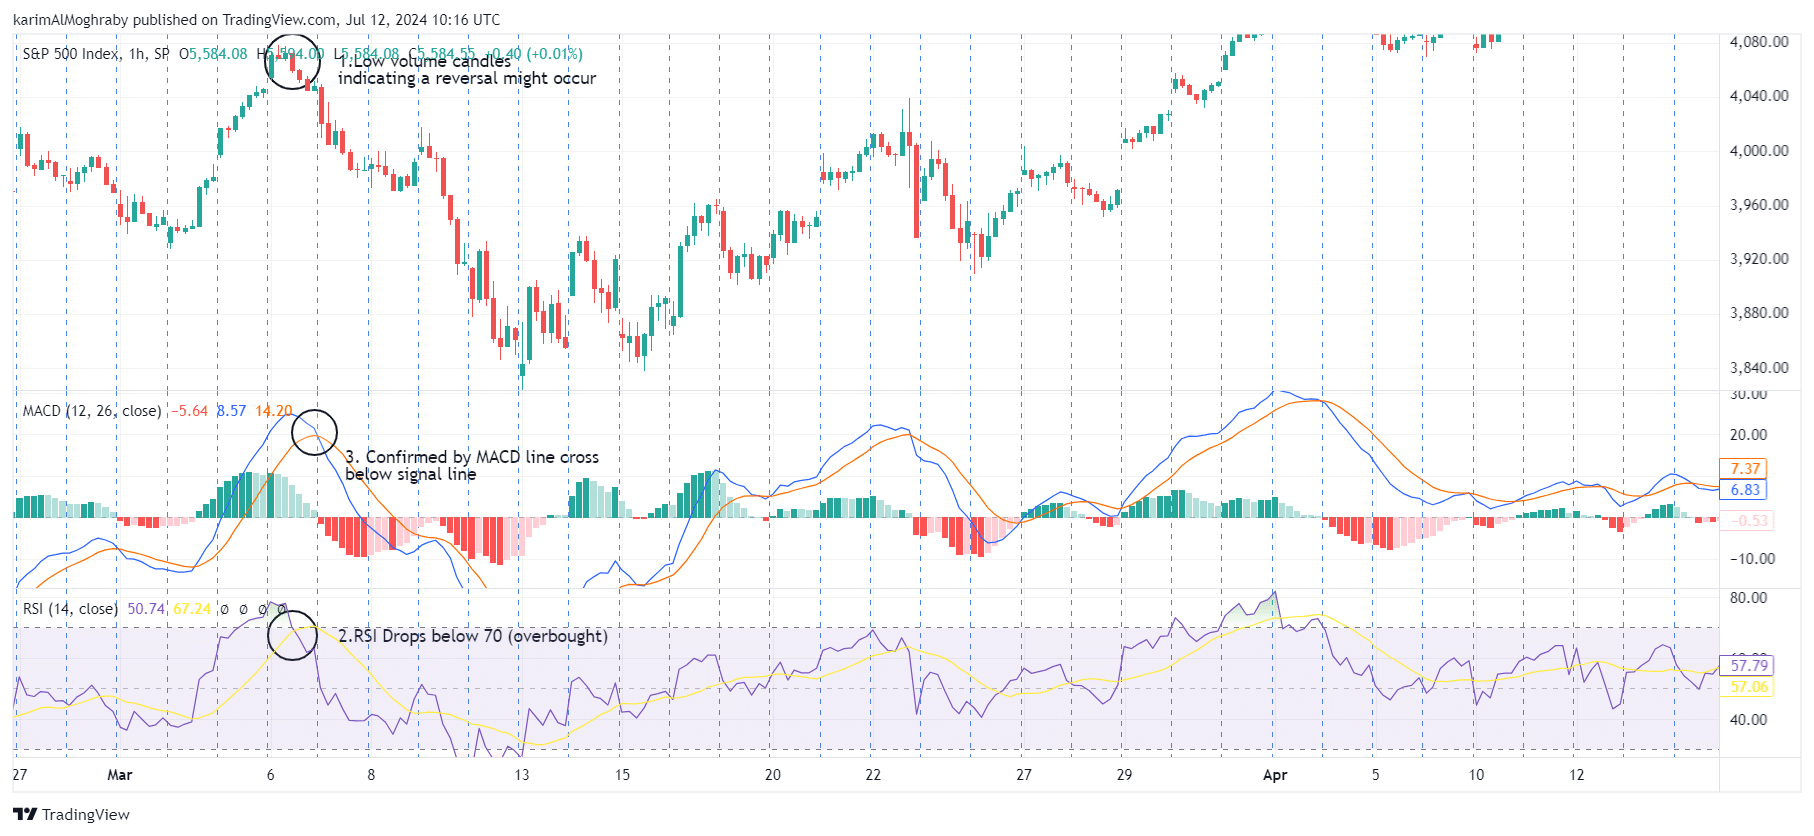
Whereas, a bearish crossover occurs when the MACD line crosses below the signal line, indicating potential downward momentum. This bearish crossover is validated if the RSI moves below the 70 level, indicating that the asset was previously overbought and is now potentially reversing to the downside.
Strategy 7: MACD and Bollinger Bands Crossover
Our final strategy for this article combines the MACD indicator with Bollinger Bands and it aims to identify potential breakouts or reversal points by leveraging the two underlying indicators.
This strategy focuses on using MACD crossovers to identify momentum shifts and Bollinger Bands to determine volatility and potential price breakout levels.
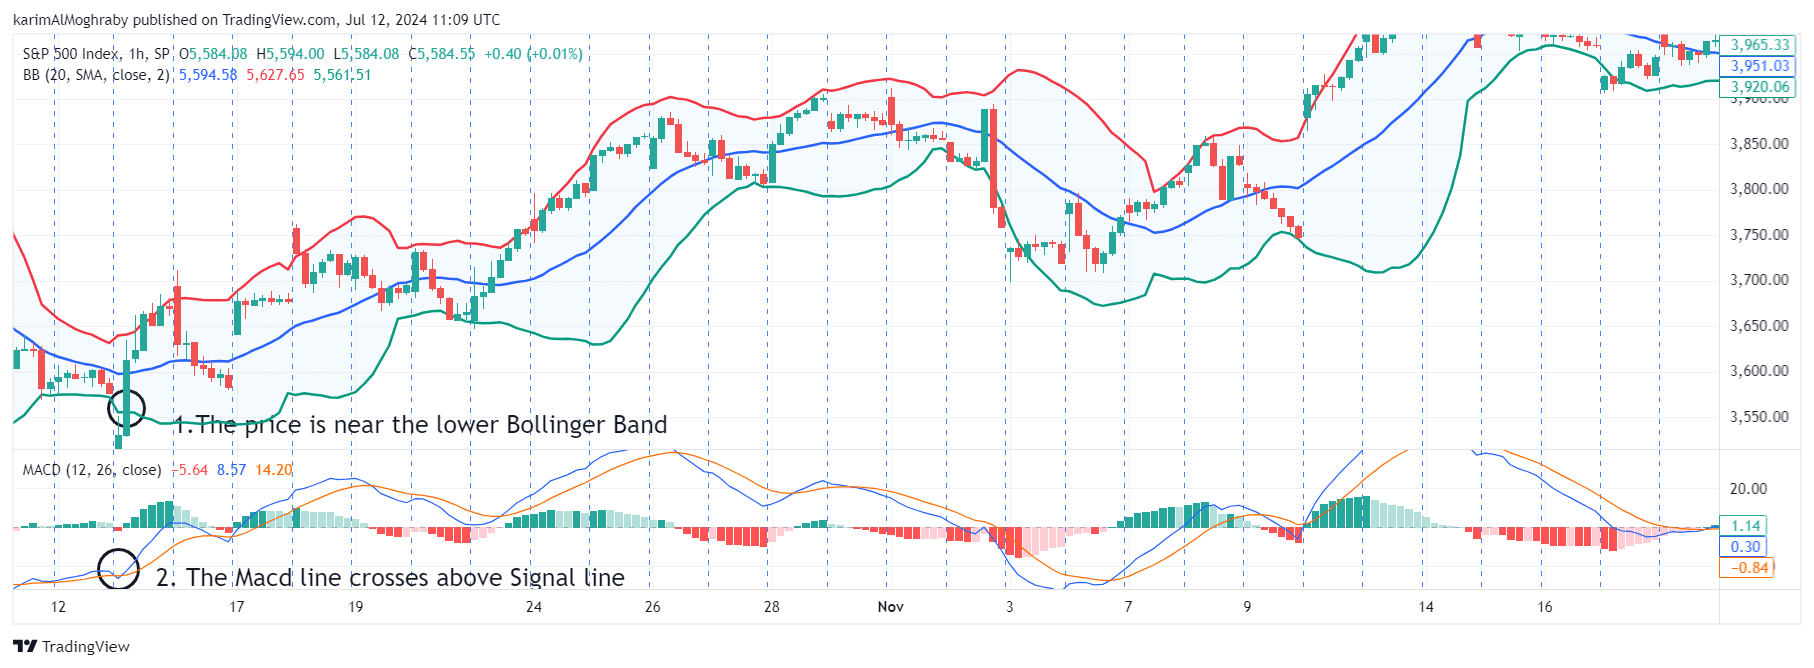
A bullish MACD crossover occurs when the MACD line crosses above the signal line, indicating potential upward momentum. This bullish crossover is strengthened when it occurs near or below the lower Bollinger Band, suggesting the asset is potentially undervalued and may experience a price rebound.
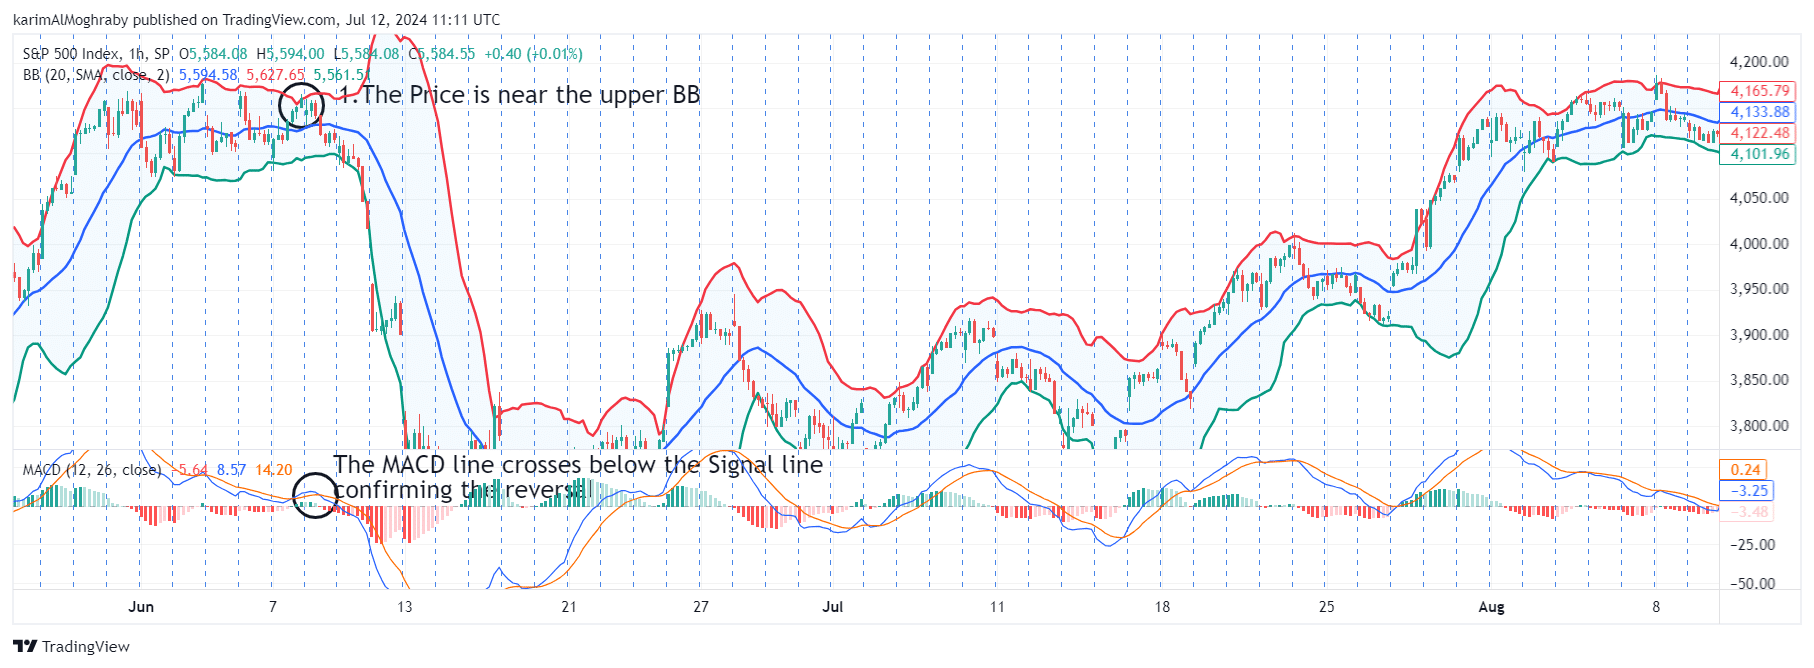
A bearish MACD crossover occurs when the MACD line crosses below the signal line, indicating potential downward momentum. This bearish crossover is validated when it occurs near or above the upper Bollinger Band, suggesting the asset is potentially overvalued and may experience a price decline.
Conclusion
Having a thorough understanding of the MACD Crossover Strategies can significantly increase a trader's ability to navigate the complexities of financial markets with confidence and precision.
Throughout this exploration of the "7 Wonders of MACD Crossover Strategies," we have explored into various techniques that harness the power of the Moving Average Convergence Divergence indicator to identify optimal entry and exit points.
However, it's crucial to remember that no strategy is infallible and traders should continuously adapt and refine their approach, considering market conditions, risk tolerance, and ongoing analysis.
By combining technical expertise with disciplined execution, traders can build a robust toolkit to navigate diverse market scenarios and maximize their potential for success in the dynamic world of trading.
Take Your Trading to Next Level
Take Your Trading to Next Level
You Might Also Like:


