We hope you enjoy reading this blog post.
Become a Pro Trader by using our fine-tuned Indicators and Expert Advisors.
How to use The MACD Indicator For Crypto Trading
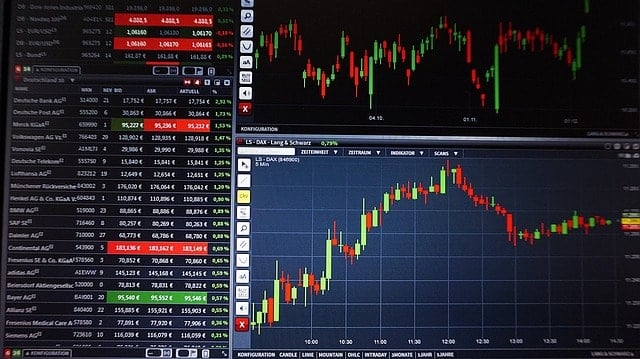
In the volatile world of cryptocurrency trading, keeping pace with the market trends is essential for making informed trading decisions. Traders extensively use technical analysis in crypto and employ various indicators to understand and manage the unpredictable market.
Among these indicators, the Moving Average Convergence Divergence (MACD) shines and takes the spotlight as it is known for its effectiveness and simplicity.
Crafted by Gerald Appel in the late 1970s, the MACD has become an essential tool for traders in all markets, including the fast-changing and volatile crypto space.
In this article we will delve into the MACD cryptocurrency use cases, the true MACD crypto meaning, its key components, and its role in identifying potential buy and sell signals, to navigate these markets like a seasoned rider.
What is the MACD Indicator?
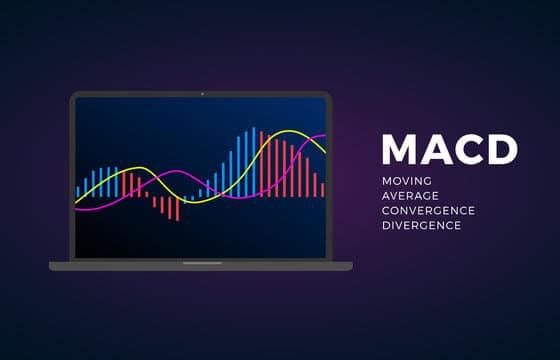
The MACD (Moving Average Convergence Divergence) is a well-known momentum oscillator that indicates the relationship between two Exponential Moving Averages (EMAs) concerning an asset's price, which is particularly useful in the dynamic crypto market.
This trend-following or delayed indicator consists of three main components:
MACD line: The core component of the technical indicator. This line is calculated by subtracting the 26-period EMA from the 12-period exponential moving average EMA (MACD = 12EMA - 26EMA).
In cryptocurrency trading, the MACD line helps traders identify shifts in momentum and potential trend reversals, which is extremely important in a market known for its rapid price fluctuations.
Signal line: After deriving the MACD line, we take the 9-day EMA of the MACD and it is known as the signal line. This line acts as a trigger for buy or sell signals. When the MACD line crosses above the signal line, it generates a bullish signal, suggesting a good time to buy.
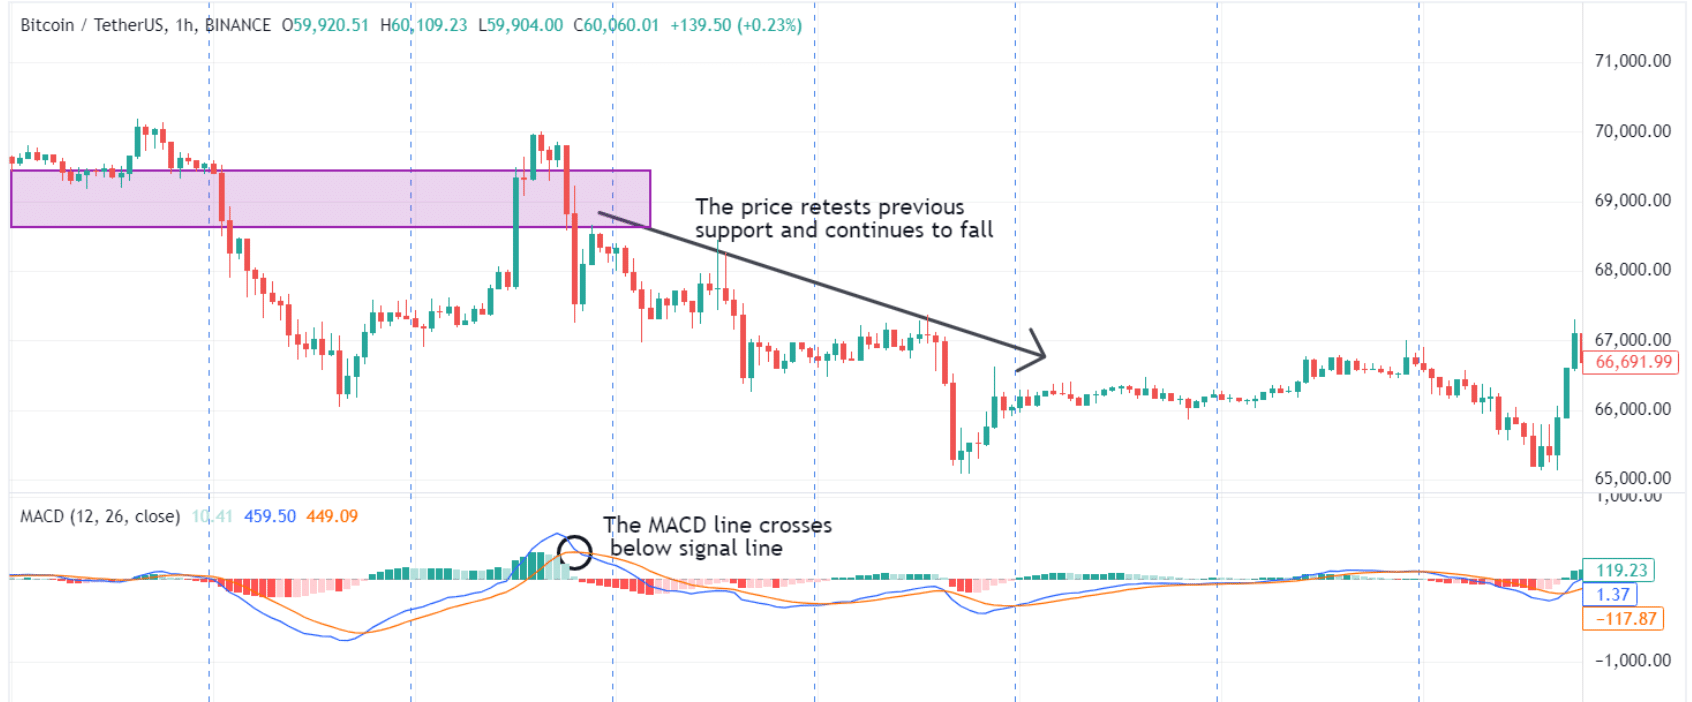
Conversely, when the MACD crosses below the signal line, it generates a bearish signal, indicating that bears are gaining control which spots indicate a bearish trend on the horizon. Therefore, a potential sell signal.
Histogram: The MACD histogram is a visual representation of the difference between the MACD line and the signal line. It graphically displays the momentum and strength of the trend. The zero line separates the positive and negative territories of the histogram, providing a clear view of market sentiment.
The histogram component is essential in the MACD for the crypto market as it helps traders quickly assess the direction and intensity of price movements, making it easier to spot potential entry and exit points. Traders became creative in their histogram strategies, like for instance, the zero line crossover strategy.
These components provide valuable insights into the overall market momentum, trend direction, and potential reversals in the highly volatile cryptocurrency market.
The MACD isn't just about tracking price changes on a chart; it delves deeper into the underlying strength or weakness of the market, helping traders make informed decisions in the fast-paced world of crypto trading.
How to Read the MACD Indicator in Crypto Markets
For any trader to find the best MACD settings for crypto trading, understanding how to read the MACD crypto indicator is the first step.
Understanding Crossovers in High Volatility
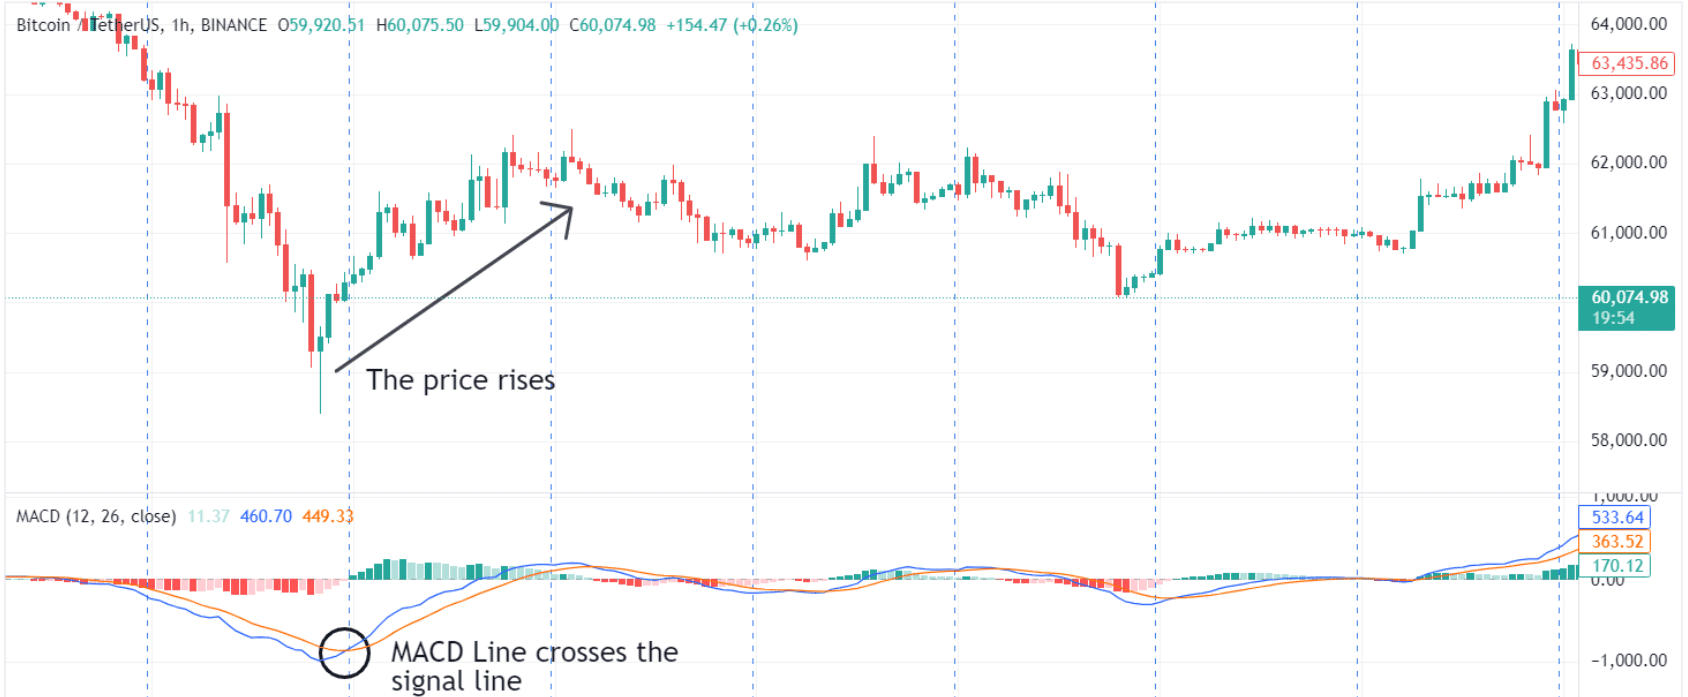
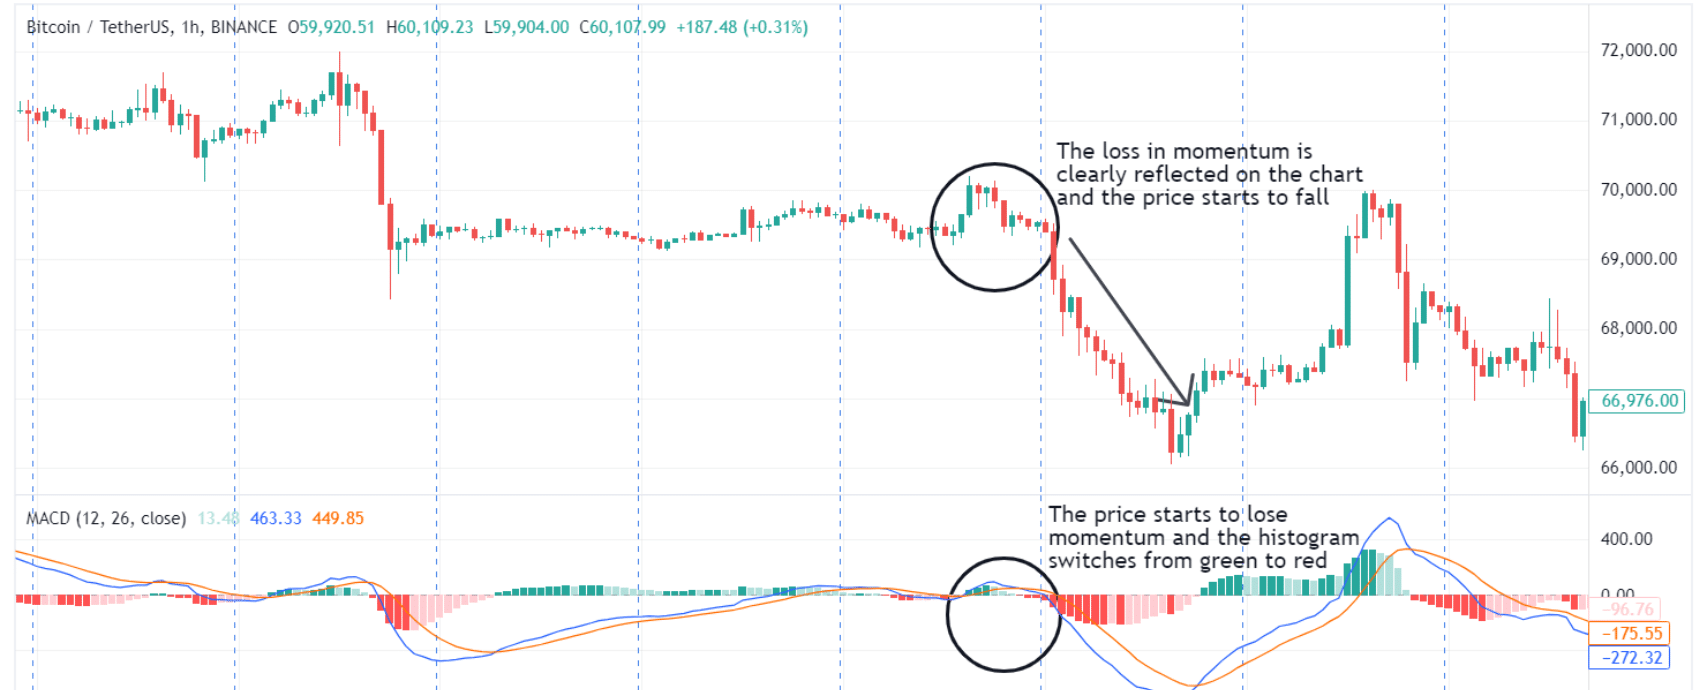
In the high volatility of crypto markets, MACD crossovers are essential signals for traders. A bullish crossover occurs when the MACD Line crosses above the Signal Line, indicating that the price is gaining upward momentum and may continue to rise.
Conversely, a bearish crossover happens when the MACD Line crosses below the Signal Line, suggesting that the price is losing momentum and may fall further.
Due to the rapid price changes in cryptocurrencies, these crossovers can provide timely entry and exit points, helping traders capitalize on short-term price movements while managing risks.
Interpreting the Histogram in the Context of Crypto
The MACD histogram is a valuable tool for interpreting market momentum in the context of crypto trading. When the histogram bars increase in height (or switch to green), it indicates that the gap between the MACD Line and the Signal Line is widening, indicating a strengthening in momentum.
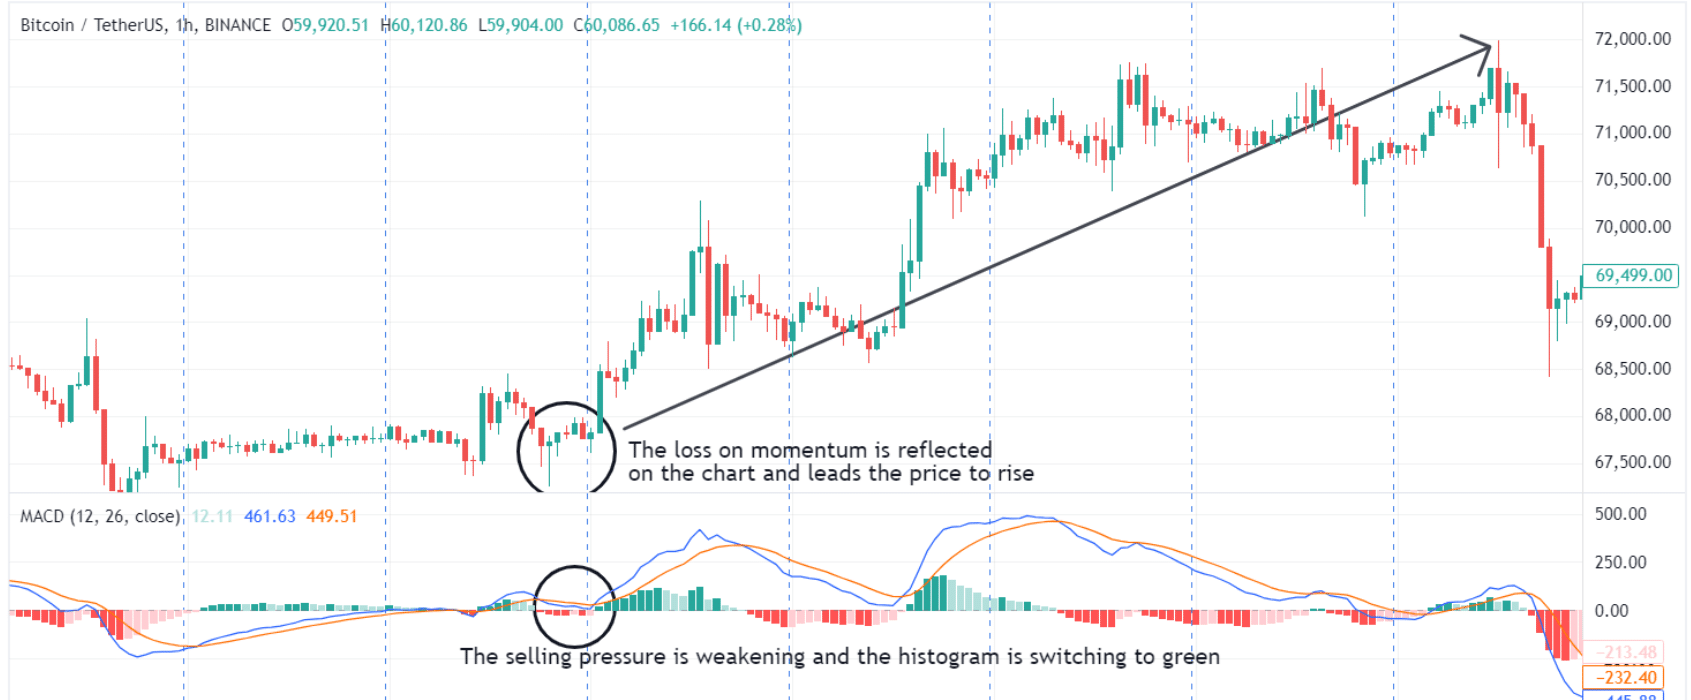
Conversely, when the histogram bars decrease in height, it shows that the gap is narrowing, suggesting weakening momentum. In the crypto market, where prices can swing dramatically, the histogram helps traders gauge the intensity of price movements and adjust their strategies accordingly.
For example, increasing positive histogram bars could signal a strong uptrend, while decreasing negative bars might indicate a weakening downtrend.
Identifying Divergence with Cryptocurrency Price Movements
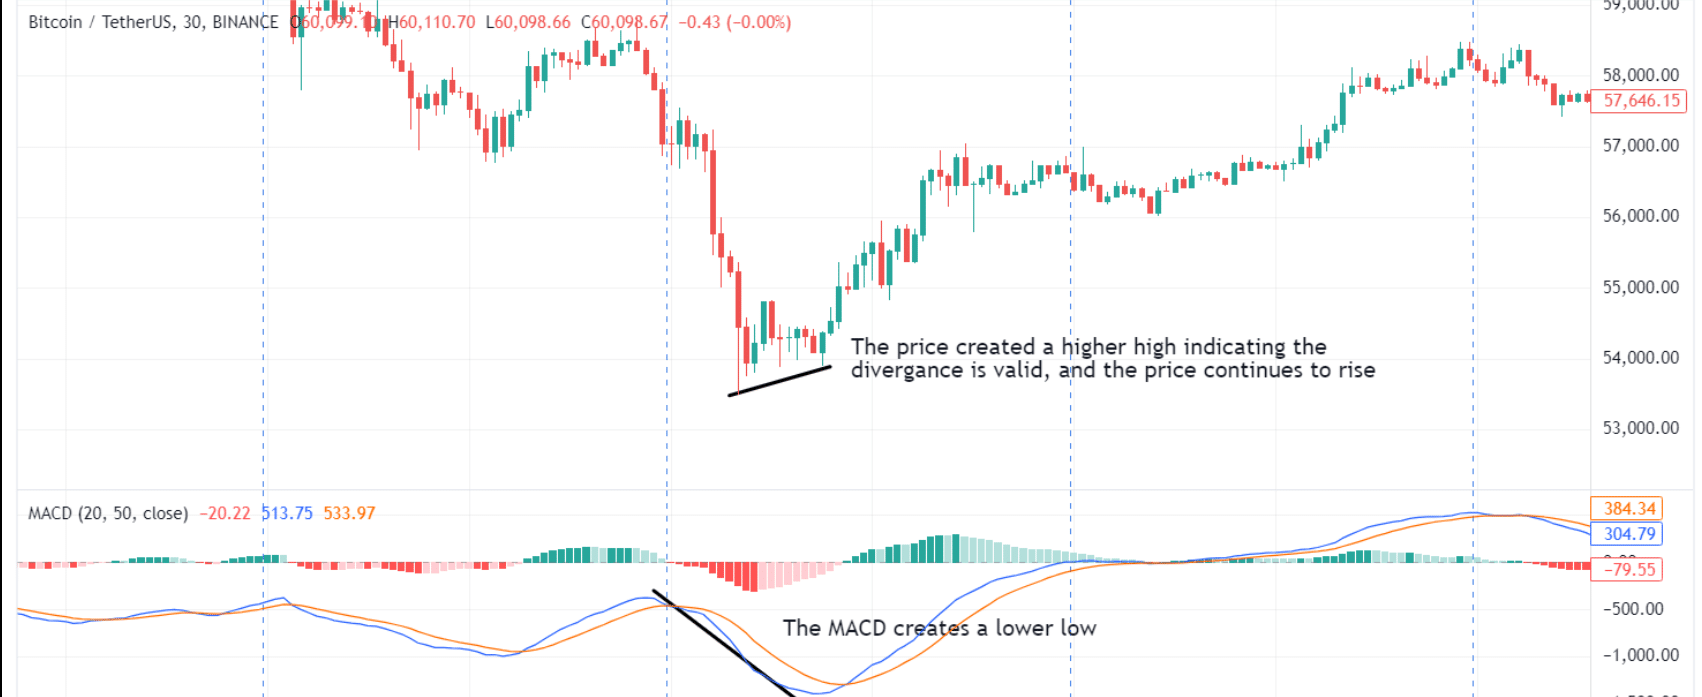
The divergence between the MACD indicator and cryptocurrency price movements can be a powerful signal of potential trend reversals. A bullish divergence occurs when the price of a cryptocurrency makes a lower low while the MACD Line forms a higher low.
This suggests that the bearish momentum is weakening, bears are starting to lose control which leads to a price increase.
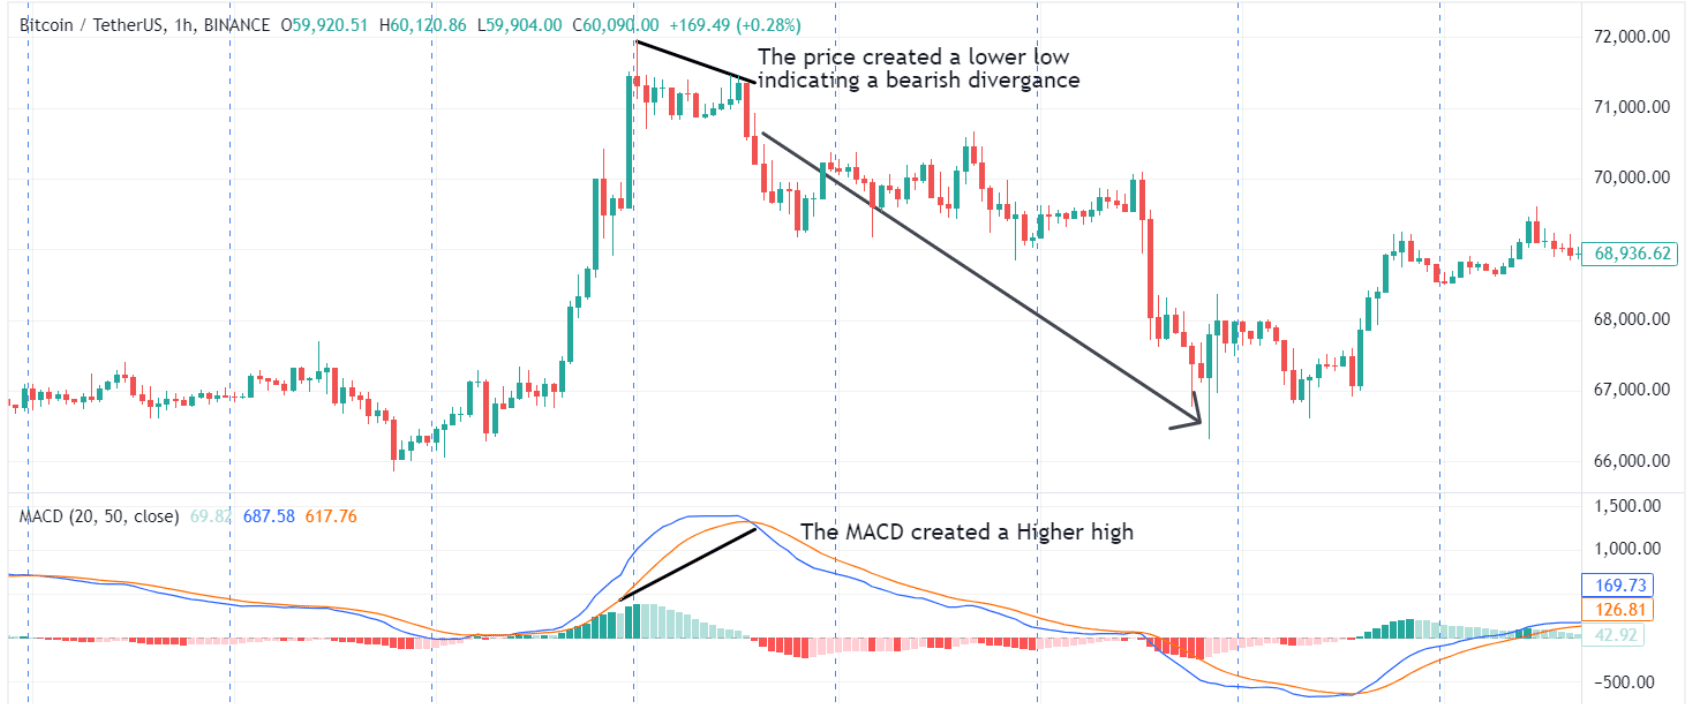
MACD Bearish divergence happens when the price makes a higher high, but the MACD Line forms a lower high, indicating that the upward momentum is losing strength and a price decline may be imminent.
Identifying these divergences in the volatile crypto markets can help traders anticipate and prepare for potential market reversals, enhancing their ability to make informed trading decisions.
Practical Application in Crypto Trading
By now, we have an overview of how valuable the MACD for crypto is, due to its great ability to filter out market noise and provide clear insight into a highly volatile market environment.
By analyzing the relation between the MACD line, signal line, and histogram. We as traders gain a better perspective on the underlying market dynamics and plan our next steps better:
- Trend Identification: The MACD line and signal line mainly help in identifying the current trend direction and its strength. Which is very crucial for the Wild West of trading.
- Momentum Analysis: Crypto has been well known for its sudden surges or drops which might create life-changing opportunities for traders, the histogram comes into action by providing a visual representation of momentum changes, allowing traders to gauge the intensity of price movements.
- Potential Reversals: Divergences between the MACD indicator and price movements can signal potential reversals. To elaborate, a bullish divergence (price makes a lower low while MACD forms a higher low) may indicate a potential upward reversal, while a bearish divergence (price makes a higher high while MACD forms a lower high) could suggest a downward reversal.
Advanced MACD Strategies for Crypto
Combining technical indicators with other tools is essential for making the statistical odds of being a profitable trader. To create some robust MACD strategies, We will explore some combinations our team suggests, including the Relative Strength Index (RSI), Bollinger Bands, or volume analysis which can be highly effective.
Each of these indicators provides unique insights into the market, and when used together, they can offer a more comprehensive view.
1. MACD and RSI
The RSI is an oscillator just like MACD but conversely, the RSI measures the speed and change of price movements to identify overbought and oversold conditions.
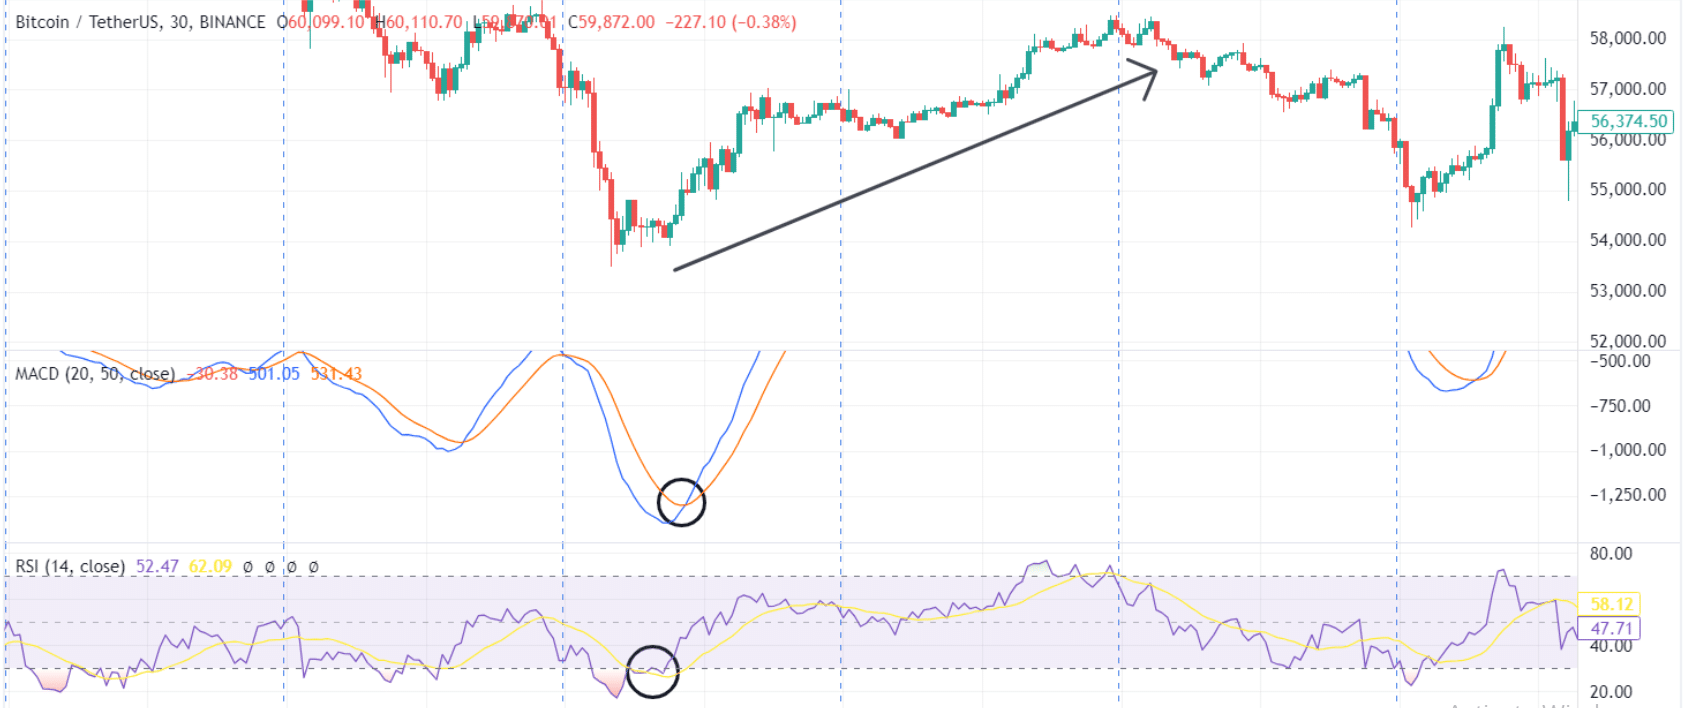
When the MACD signals a potential buy (usually a bullish crossover) and the RSI indicates an oversold condition, this can create more certainty and confidence about a potential buy signal.
On the other hand, a bearish crossover in the MACD combined with an overbought RSI can signal a stronger sell indication. We have covered MACD and RSI strategies in detailed before.
2. MACD and Bollinger Bands
The Bollinger Bands measure market volatility and provide upper and lower price lines around a moving average those lines are called bands.
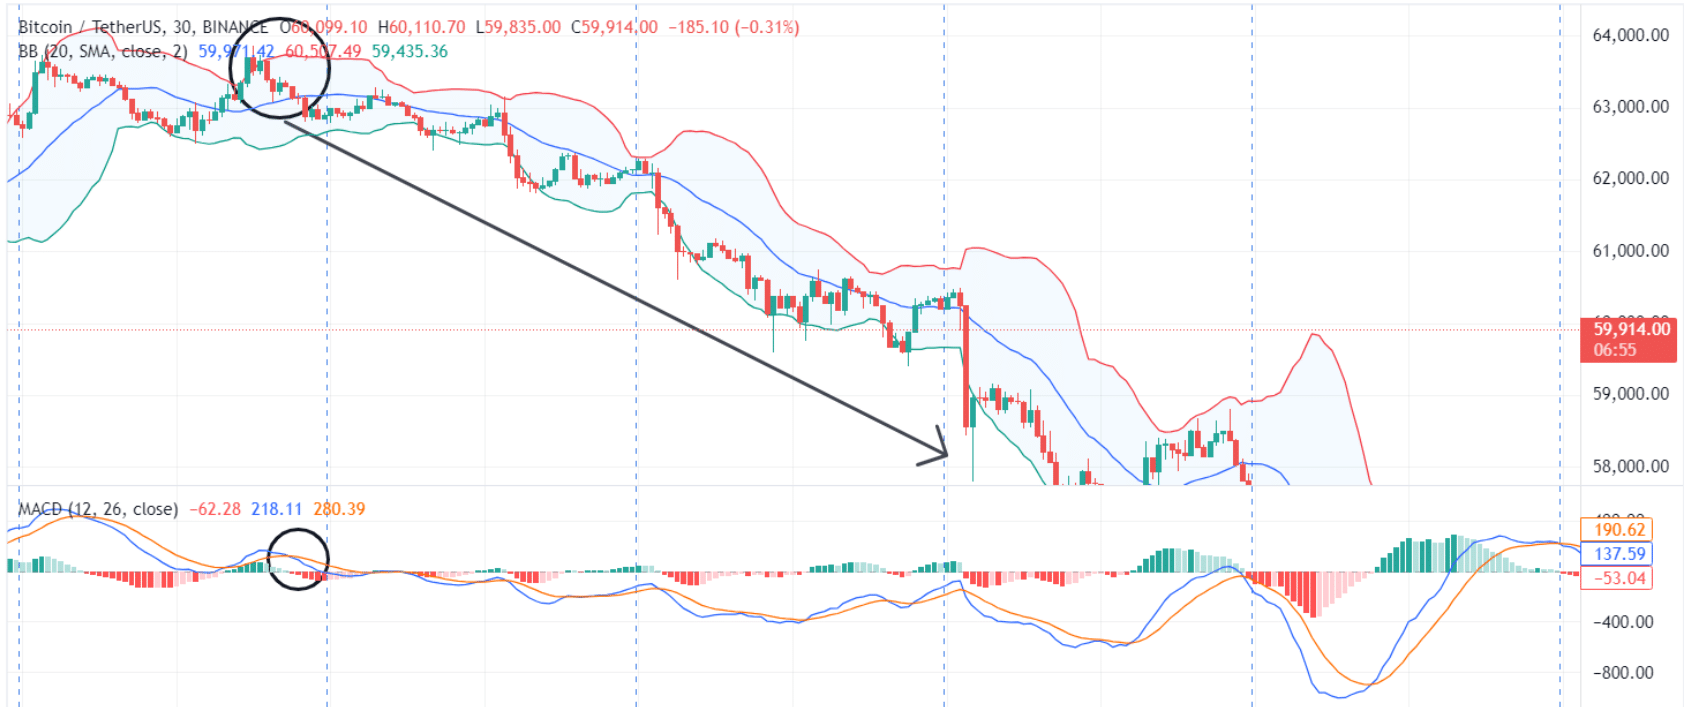
When the MACD signals a bullish crossover and the price is coming near the lower band, it can suggest a strong buying opportunity as the price may revert to the mean. Similarly, a bearish crossover near the upper Bollinger Band can indicate a selling opportunity.
3. MACD and Volume Analysis
Most cryptocurrencies are traded on centralized exchanges that have a defined trading volume visible. We can use the trading volume to add another layer of confirmation to our MACD crypto signals.
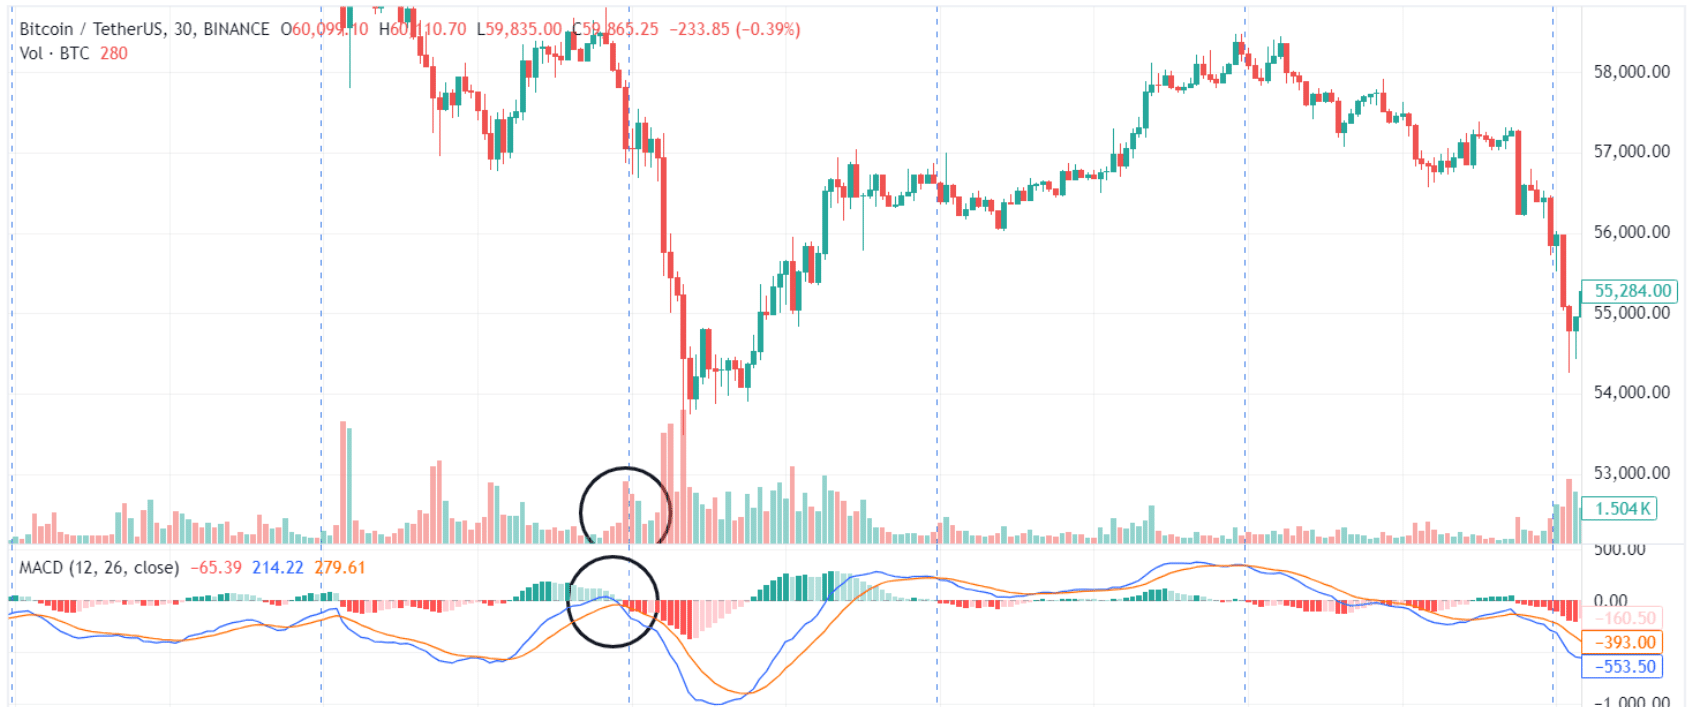
To elaborate, when the positive volume is increasing rapidly and the MACD performs a bullish crossover, this can be our signal to get into a buy trade. Conversely, a bearish crossover with rising volume can confirm selling pressure.
Adapting MACD Settings for Different Cryptocurrencies
Different cryptocurrencies exhibit unique price behaviors and volatility levels which require customized MACD settings to enhance effectiveness, and leaves the statement ''Best MACD settings for crypto'' pretty subjective.
However, adjusting the MACD parameters can help tailor the indicator to better suit specific cryptocurrencies and the trading style used.
- Shorter EMAs for Highly Volatile Cryptos: For highly volatile cryptocurrencies like Bitcoin or smaller altcoins, using shorter EMA periods (e.g., 9-day and 21-day) can make the MACD more responsive to rapid price changes, providing earlier signals.
- Longer EMAs for Stable Coins: For more stable cryptocurrencies, such as large-cap coins like Ethereum, using longer EMA periods (e.g., 15-day and 30-day) can help filter out noise and provide more reliable signals.
- Experimenting with Signal Line Periods: Adjusting the signal line period can also impact the MACD's sensitivity. A shorter signal line period (e.g., 6-day EMA) can generate more frequent signals, suitable for active traders.
A longer signal line period (e.g., 12-day EMA) can provide more stable signals, ideal for long-term traders.
Risk Management
Risk management strategies are essential when trading any type of financial market to minimize potential losses and protect your hard-earned capital.
- Setting Stop-Loss Orders: Always plan your stop-loss orders before entering a trade to limit any potential losses in case the market moves against you.
For example, placing a stop-loss just below the recent swing low for a long position or above the recent swing high for a short position can help protect your investment. - Position Sizing: Never risk more than a small percentage of your trading capital on a single trade (e.g., 1-2%) to prevent significant losses.
- Diversification: Diversify your portfolio by trading multiple cryptocurrencies rather than focusing on a single asset. This can help spread risk and reduce the impact of adverse price movements in one particular cryptocurrency.
- Monitoring Market Conditions: As we know, the crypto market is extremely sensitive to news, so keep an eye on broader market conditions and news events that could impact cryptocurrency prices.
By integrating the MACD indicator with other technical tools, tailoring its settings for various cryptocurrencies, and applying robust risk management practices, traders can refine their strategies and navigate the volatile crypto market with greater confidence and success.
Watch Out for False MACD Signals
You will sometimes see false signals from the MACD, meaning crypto traders should know the indicator’s pitfalls before incorporating the indicator into a strategy.
They are most frequently produced in flat or ranging markets. Momentum is easy to determine when prices are volatile and trending; when the market is flat, the two EMAs making up the MACD line won’t see much separation.
This can result in whipsawing action in the indicator, with the MACD and signal lines crossing over often. It’s normally best to wait for the market to begin trending again before considering a position.
It’ll also occasionally produce conflicting signals. For instance, you may see a bullish signal line crossover while a bearish divergence forms. In these scenarios, gaining further insight from other technical tools is a good idea.
If the bearish divergence occurs at a significant resistance level, then you have extra confirmation that a reversal is likely. You can then hold fire until a bearish signal line crossover occurs to jump in on the reversal trade.
Take Your Trading to Next Level
Take Your Trading to Next Level
You Might Also Like:


