We hope you enjoy reading this blog post.
Become a Pro Trader by using our fine-tuned Indicators and Expert Advisors.
MACD vs Stochastic: A Detailed Comparison and Trading Guide

The journey to identify the best trading indicators is long and a continuous process among most forex traders. It is a time-consuming and exciting mission at the same time. We advise, that rather than trying to invent the wheel, it is better to apply what other traders have tested and applied.
At Keenbase-Trading, we continuously explore strategies that empower traders with the tools they need to succeed. One such approach involves comparing two popular technical indicators: MACD and the Stochastic Oscillator.
Both indicators are widely used for their ability to signal potential market reversals and trend strength, but they operate on different principles and can offer distinct insights so you can have a double-sided overview of the market.
In this article, we will delve into the fundamentals of the MACD and Stochastic oscillator, providing a deep understanding of their calculations, applications, and the key differences between them.
We will also explore strategies that combine these indicators, helping traders enhance their market analysis and make more informed decisions.
We will address the following questions:
What are the MACD and Stochastic Oscillator indicators?
How can the MACD and Stochastic be used in trading?
MACD vs. Stochastic: Which is better?
Strategies for using MACD and Stochastic together
Understanding MACD and Stochastic Oscillator indicators
The Stochastic Oscillator and Moving Average Convergence Divergence (MACD) stand out as two of the most influential technical indicators in the trading world.
Each offers a distinct lens through which to view market dynamics, and when combined, they provide a powerful toolkit for understanding market momentum and potential reversals
What is the MACD and how it is calculated
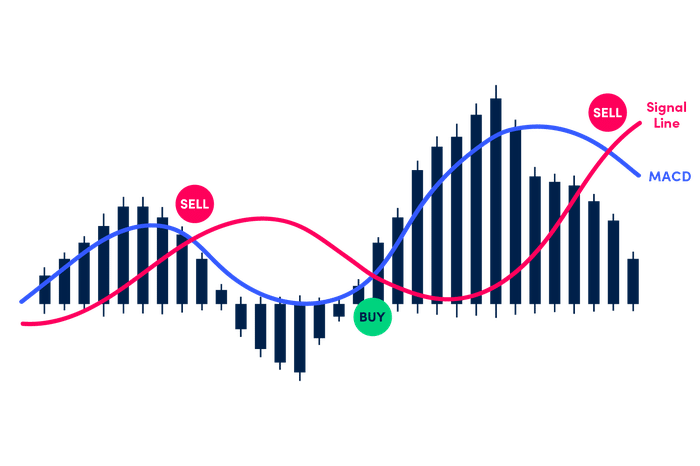
MACD is a popular momentum indicator that shows the relationship between two exponential moving averages (EMAs) concerning a security's price movements. The trend-following oscillator consists of three main components, a signal line, a histogram, and a MACD line.
When combined they provide valuable insight into the overall market trend, potential reversals, and momentum. It’s not just about price changes but about understanding the underlying strength or weakness in a market.
On default MACD settings, a 9-day EMA of the MACD called the “signal line,” is then placed above the MACD line, which functions as a trigger for buy and sell signals.
The MACD line is calculated by subtracting the 26-period Exponential Moving Average (EMA) from the 12-period EMA. (MACD= 26EMA –12EMA).
Mainly, the MACD line fluctuates above and below the zero level. The signal line is derived from a 9-period EMA of the MACD line, and it moves in tandem with the MACD line.
At times, the MACD line itself is represented visually as a histogram.
As we have suggested earlier the MACD is an oscillator, but it is not commonly used to identify overbought or oversold conditions.
How to trade the Moving average convergence divergence
There are several common strategies traders around the world use to trade using to integrate MACD within their trading strategies.
1. Zero line crossover:
This strategy is particularly about using the zero line of the MACD. It involves buying when the MACD line crosses the zero line upwards, and it's believed to be a bearish signal when the zero line crosses down the MACD line.
This strategy is known to be delayed, so we don't recommend relying on the zero-crossover entry as it might be late. The zero crossovers can be used as a setup for trading using either buying or selling tactics.
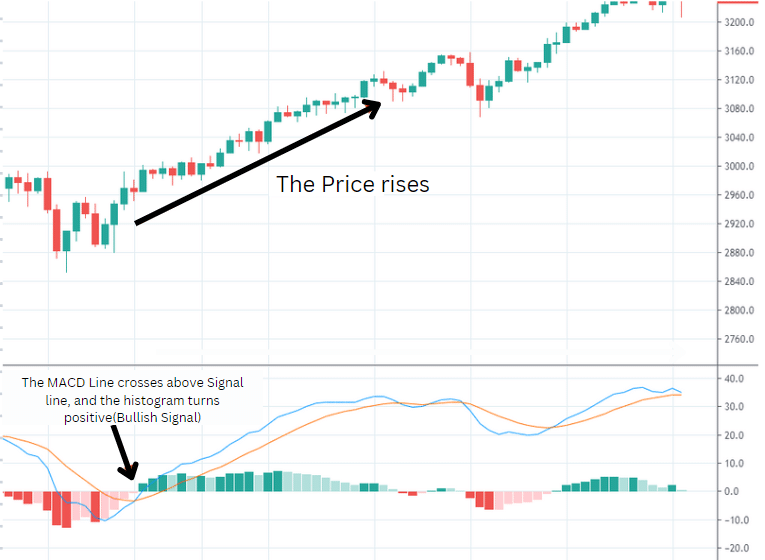
2. Crossover between MACD and signal line
When the MACD line crosses the signal line, technical analysts suggest that it is a signal for an upward trend. Whereas, when the MACD line crosses down the signal line, suggesting a bearish crossover.
However, keep in mind that the MACD is a lagging indicator, traders might experience the pitfall of false breaks.
3. Histogram Divergence
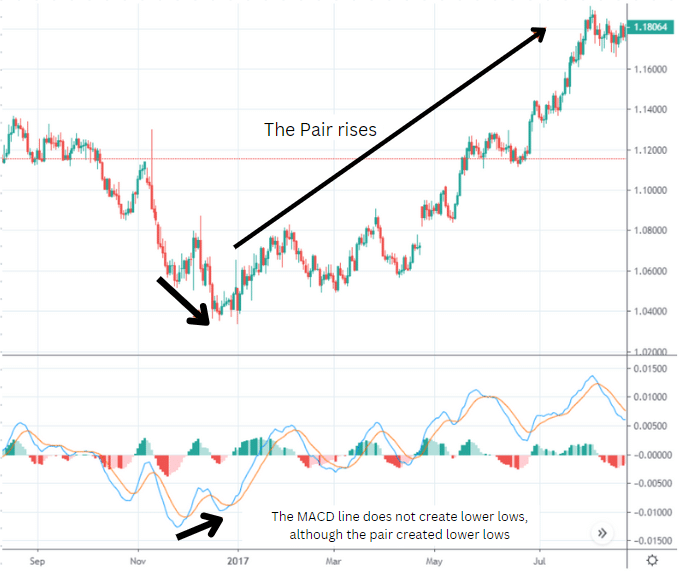
This occurs when the price reaches a lower low, but the histogram forms a higher low, indicating that the selling pressure is weakening and suggesting a potential upward reversal.
Conversely, when the price makes a higher high and the histogram shows a lower high, it signals that buying pressure is diminishing, suggesting a potential downward reversal.
What is the Stochastic Oscillator and how it is calculated
The Stochastic Oscillator is a technical momentum indicator, similar to the RSI, but with a unique approach to assessing market conditions.
The Stochastic Oscillator compares the closing price of an asset to its price range over a specific period, typically 14 periods (Default), to identify potential reversal points and overbought or oversold conditions.
The Stochastic Oscillator values range from 0 to 100. Readings above 80 generally indicate an overbought condition, while readings below 20 suggest the market is oversold.
However, similar to the RSI, assets that appear overbought or oversold according to the Stochastic Oscillator may not immediately reverse, making it essential to confirm signals with additional indicators rather than relying solely on this tool.
The Stochastic Oscillator consists of two lines: %K and %D.
The %K line represents the raw Stochastic value, while the %D line is a smoothed version of %K, often calculated as a simple moving average (SMA) of %K over three periods. The formula for %K is:
%K=(Current Close−Lowest Low/Highest High- Highest Low)x 100
Where:
- Current Close = The closing price of the current period.
- Lowest Low = The lowest price over the last 14 periods (or the chosen period).
- Highest High = The highest price over the last 14 periods (or the chosen period).
Once %K is calculated, the %D line is derived as follows:
%D= SMA of %K over 3 periods
making %D a signal line that helps identify potential crossovers.
How to Trade the Stochastic Oscillator
Here are three common methods to trade using the Stochastic Oscillator:
- Overbought/Oversold Signal: When the Stochastic Oscillator is above 80, the market is considered overbought, and when it falls below 20, the market is considered oversold. These thresholds can be adjusted to suit different market conditions.
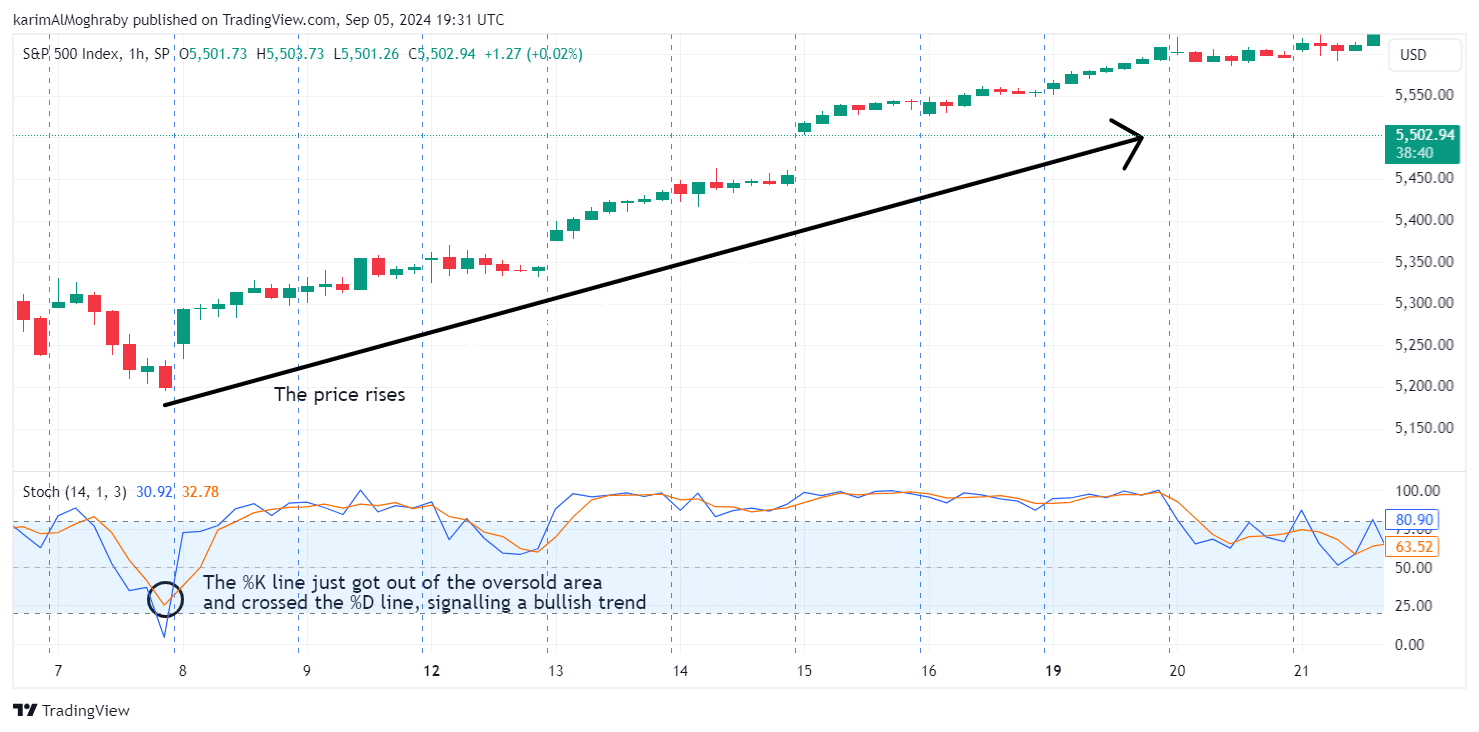
For example, in a market that frequently reaches the overbought level, you might raise the threshold to 90. Keep in mind that during strong trends, the Stochastic Oscillator can remain in overbought or oversold territory for extended periods, so you might adjust your oscillator based on that. - Stochastic Crossovers: Crossover occurs between the %K and %D lines. A bullish signal occurs when the %K line crosses above the %D line, suggesting upward momentum. Conversely, a bearish signal happens when the %K line crosses below the %D line, indicating downward momentum.
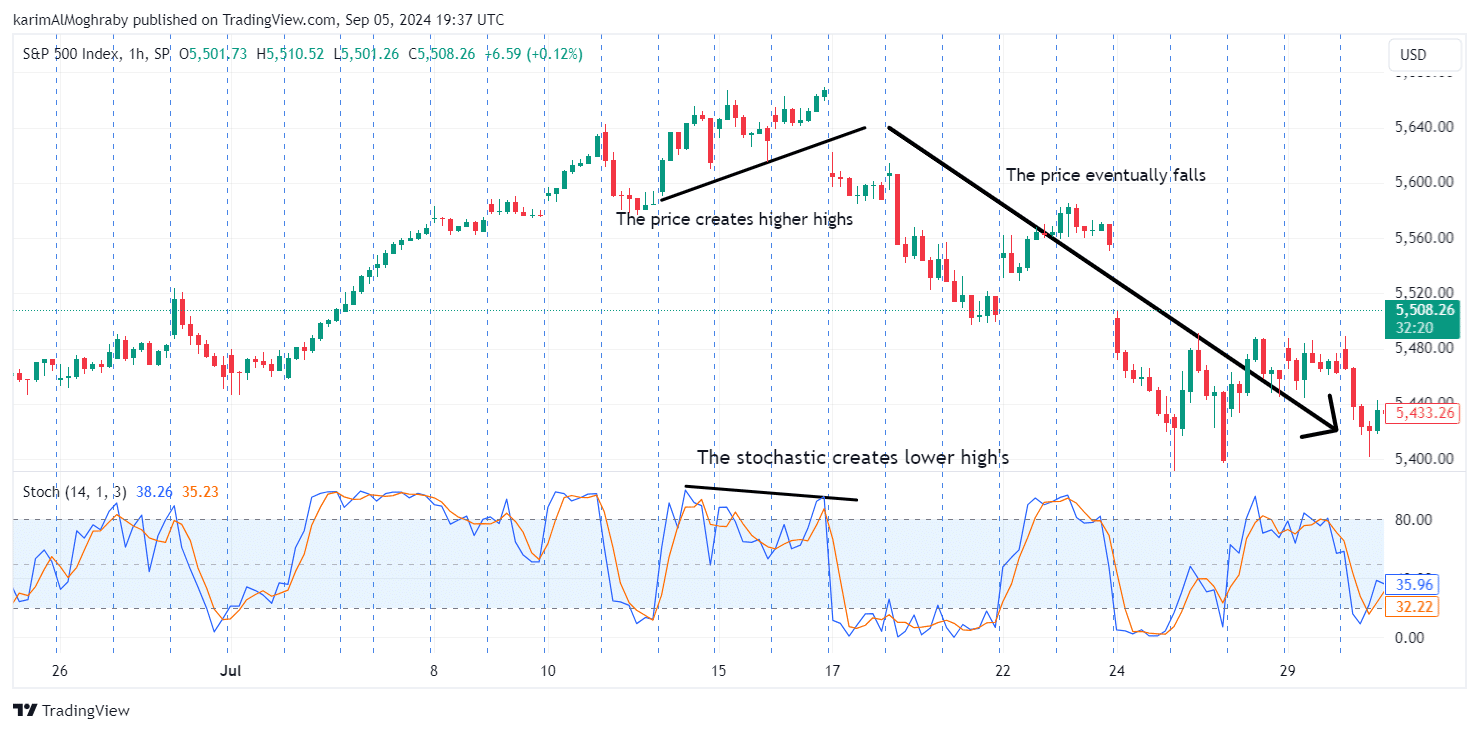
- Divergence: Divergence between the Stochastic Oscillator and price action can signal potential reversals. For instance, if prices are making higher highs while the Stochastic Oscillator is making lower highs, this bearish divergence could indicate weakening momentum and a possible price drop.
On the other hand, a bullish divergence occurs when prices make lower lows while the Stochastic Oscillator makes higher lows, suggesting a potential upward reversal.
Stochastic vs. MACD
As we suggested both the Stochastic oscillator and the MACD have different sets of characteristics making each indicator unique in its way.
Stochastic vs. MACD – Purpose and Usage
The main purpose of the Stochastic oscillator is to identify overbought or oversold conditions in the market by comparing the closing price of an asset to its price range over a specific period, assisting traders in determining if the market is ready for a reversal which makes it particularly effective in range-bound markets.
On the other hand, the MACD is designed to identify the direction, strength, duration, and momentum of a trend. It is particularly useful in trending markets, helping traders decide whether to stay with the trend or exit when the MACD shows signs of weakening momentum.
Stochastic vs. MACD – Potential Drawbacks
Keep in mind that no indicator is perfect and has no flaws. One of the primary drawbacks of the Stochastic Oscillator is its susceptibility to producing false signals in trending markets.
During strong uptrends or downtrends, the Stochastic can remain in overbought or oversold territories for extended periods, misleading traders into thinking a reversal is imminent. This can result in premature exits or missed opportunities.
The MACD also has its limitations, most notably its tendency to lag behind real-time price movements. Since the MACD is based on moving averages, which are inherently backward-looking, the signals it generates—such as crossovers between the MACD line and the signal line—often occur after the price movement has begun.
This lag can lead to late entries or exits, causing traders to miss the most opportune moments to trade.
Stochastic-MACD Crossover Strategy: A Professional Approach
In this article, we’ve already explored the MACD and Stochastic Oscillator individually. Now, let’s dive into a strategy that effectively combines these two powerful indicators—the Stochastic-MACD Crossover Strategy.
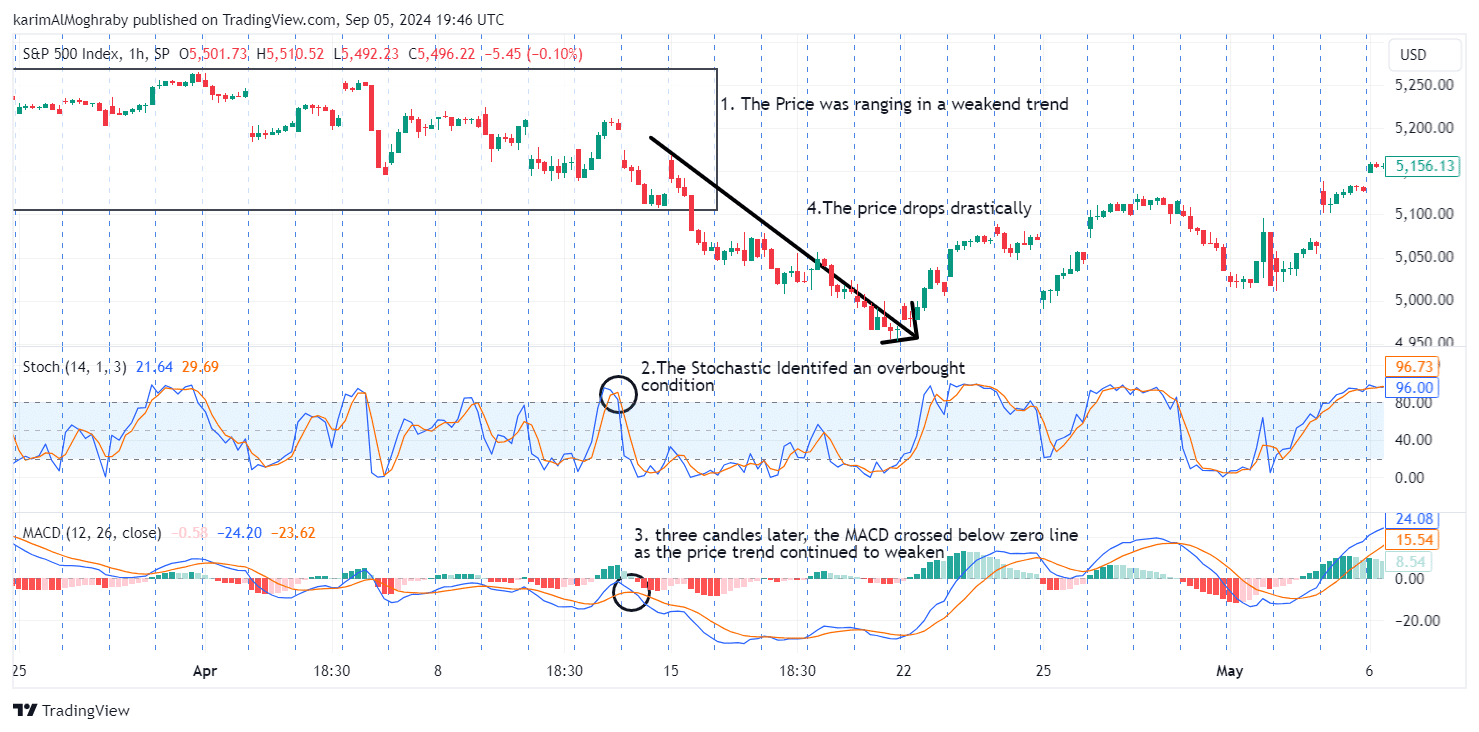
- MACD Crossover: Start by observing the MACD. When the MACD line crosses above the signal line, it indicates a potential bullish trend. Conversely, when the MACD line crosses below the signal line, it suggests a bearish trend is likely.
- Stochastic Confirmation: After identifying a potential trend with the MACD, turn to the Stochastic Oscillator for confirmation. In a bullish scenario, look for the Stochastic to emerge from oversold territory (below 20) and cross above 20.
For a bearish scenario, watch for the Stochastic to exit the overbought territory (above 80) and cross below 80. - Trade Execution: Once both indicators confirm the signal—MACD crossover and Stochastic momentum—enter the trade. This dual confirmation helps to ensure that you are entering a trade with both trend strength and momentum on your side.
- Exiting the Trade: Use the opposite signal for exiting the trade. For instance, if you entered on a bullish MACD crossover and Stochastic confirmation, exit when the MACD crosses back below the signal line and the Stochastic enters overbought territory.
We've also covered some MACD and RSI strategies but please keep in mind that no strategy is fool-proof, and no indicator is perfect.
Conclusion
In conclusion, both the MACD and Stochastic Oscillator offer unique advantages and insights for traders. While the MACD excels in identifying trend direction and momentum in trending markets, the Stochastic Oscillator is better suited for spotting overbought and oversold conditions in range-bound environments.
By understanding their distinct purposes and potential drawbacks, traders can better select the indicator that aligns with their trading style and market conditions.
As always, it’s essential to back-test and refine any strategy to suit specific trading environments and personal risk tolerance. Successful trading requires continual learning, adapting strategies based on market dynamics, and integrating multiple indicators to build a well-rounded approach.
Keep honing your skills and stay vigilant in your market analysis to navigate the complexities of trading more effectively.
Take Your Trading to Next Level
Take Your Trading to Next Level
You Might Also Like:


