We hope you enjoy reading this blog post.
Become a Pro Trader by using our fine-tuned Indicators and Expert Advisors.
Pin Bar Trading Strategies - How to trade using Pin Bar Patterns.
This article will thoroughly go over the basic understanding of a pin bar candlestick pattern followed by some effective trading strategies and trade management of the same.
Introduction
Candlestick patterns are tools that forecast the price based on the past movement in the market. Several candlestick patterns in the industry are used by traders and investors to make trading decisions.
In this article, we will be touching grounds on the famous pin bar candlestick pattern. We shall start from the basics and logic behind the pin bar candlestick pattern formation and then go ahead with some compelling pin bar trading strategies.
What is a Pin Bar Candlestick Pattern?
A pin bar is a type of candlestick with some significance that tries to predict the market's future price action. In terms of the structure, a pin bar candlestick is made of a small body and long tail or wick.
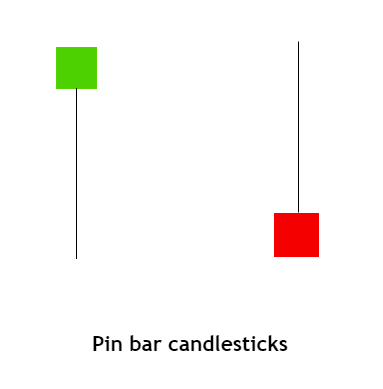
Pin bars are a clear candlestick pattern when comprehended and used correctly. It gives meaningful insights into the happenings in the market, through which can speculate on the future.
There are several pin bar trading strategies over the internet, yet most do not work consistently. This is because the candlestick pattern is often misinterpreted.
A pin bar is not merely an indication that gives trading signals, but a candlestick with a logical story in itself.
Types of Pin Bar Pattern
Based on the direction a pin bar indicates, we can have two types of pin bars.
Bullish Pin Bar
A bullish pin bar is a candlestick pattern that indicates a bullish sentiment in the market.
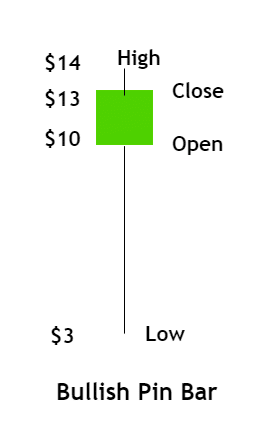
To consider a legitimate bullish pin bar, the candle's body must close above 50% of the entire candlestick's length. The pin bar is a type of candlestick with a long tail in the bottom and short body.
Interpretation
Let us consider the below-illustrated figure to comprehend a bullish pin bar. The market opens at $10, drops down aggressively to $3, shoots up to $14, and closes at $13.
What does the long tail in the market depict?
A drop from $10 to $3 indicates that the bears have taken over the market. But the demand at $3 was so significant that the bulls bought the security aggressively. As a result, the candlestick left a tail at the bottom.
Following the buyers' strong recovery, the market went to trade above the open price and close at $13. This implies demand in the market.
A bullish pin bar in the market implies that the buyers are showing aggressive signs of bullishness, and the same is expected to continue in the subsequent sessions.
With this comprehension in mind, we can come up with several pin bar trading strategies.
Bearish Pin Bar
Conversely, a bearish pin bar is a candlestick that indicates upcoming bearishness in the price.
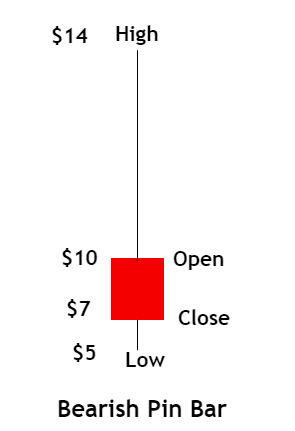
A bearish pin bar is formed when the candlestick's body closes 50% below the candlestick's length. It is a candlestick having a short body and a long wick on the top.
In the below bearish pin bar, the market opens at $10, rose higher, and made a high to $14. However, the market shot right back down to $5 and closed a couple of dollars higher at $7.
In this entire price action, the market attempts to go higher from the open price but gets rejected firmly by the sellers. This is the reason; the market ended up leaving a wick on the top. The candlestick closed red (below the open price), indicating a bearish sentiment in the market.
Trading the Pin Bar
Pin bar being a popular candlestick pattern, traded extensively across all types of instruments. There are tons of pins bar trading strategies all over the internet. Yet, many have defect fails to show good results. This is because the pin bar works only when it appears in the right location irrespective of the timeframe.
Factors that make pin bar trading strategies work
A couple of considerations need to be made to speculate using the pin bar trading strategies:
- The area where the pin bar occurs on the price chart should be logical.
- The strength of the market before the formation of the pin bar must be weak.
If these criteria are applied to every pin bar trading strategy, the higher will be the odds in your favor. Taking these factors into account, here are some effective pin bar trading strategies.
Pin Bar Trading Strategies
Pin Bar Strategy 1
The first strategy deals with the concept of Support and Resistance. Or we might as well call it Demand and Supply. Support (Demand) is the region where the buyers tend to show power.
And as a result, the price shoots up from that level. Similarly, Resistance (Supply) is the market area, where the sellers/bears tend to show strength, resulting in the market to drop.
A pin bar is essentially used to determine if there will be a mini reversal in the market. With these concepts in mind, the pin bar candlestick is bought in as a confirmatory tool go long or short.
Live Chart Example
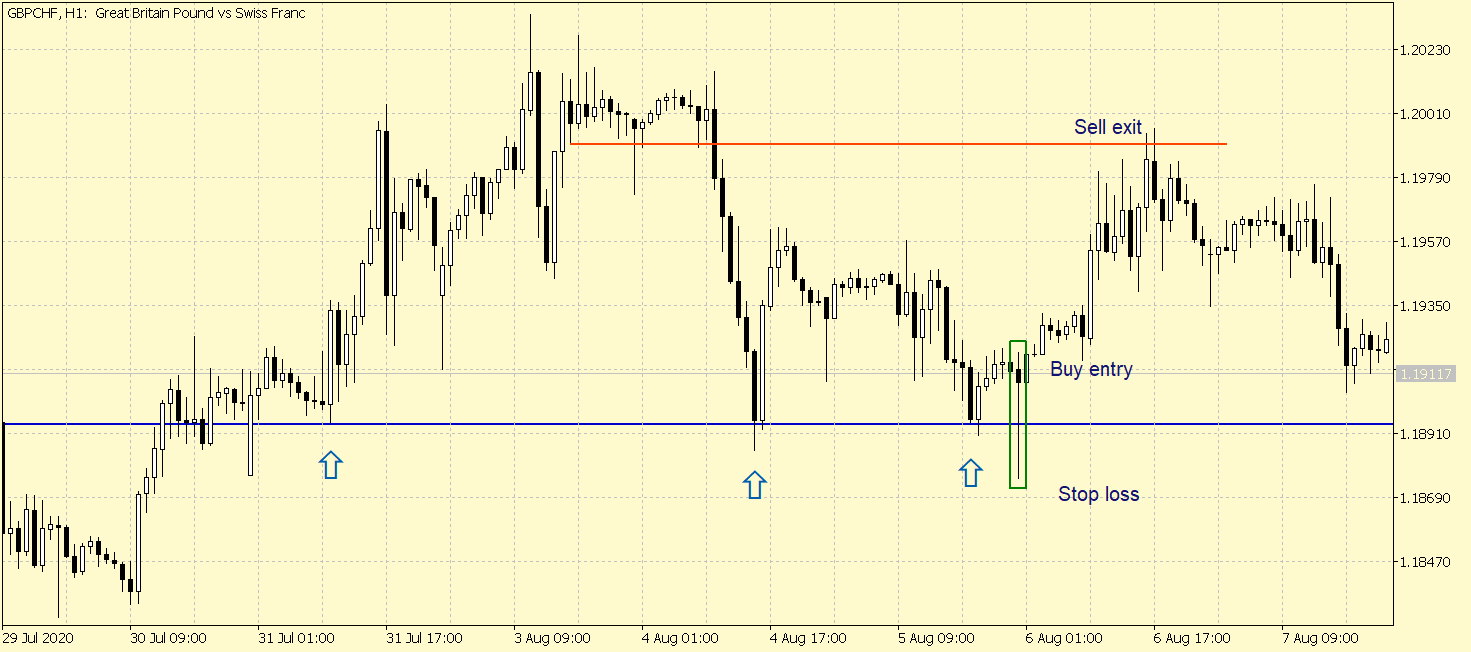
Below is the price chart of GBPCHF on the 1-Hour timeframe. By analyzing the market from the left, the aggressively shot up from the marked arrow. After a few swings, the price came down to the same area showed bullishness yet again. This confirms that the blue ray is a potential support level.
When the market dropped to the support region the subsequent time, a bullish pin bar occurred. This implies the sellers tried to go lower than the Support but failed, as the buyer kicked in strong.
Traders can go long right after the candlestick occurrence or wait for a bullish candlestick following it for added confirmation.
Take Profit
The Take Profit can be placed at a strong resistance or a potential supply area. Since this pin bar trading strategy is not a trend trading strategy, it is not ideal to anticipate a higher high.
Stop Loss
The stop-loss must be placed either below the support or the pin bar's low, whichever is lower.
Pin Bar Strategy 2
The second pin bar trading strategy deals with trend trading. A trending market is a sequence of higher highs and higher lows, or lower lows and lower highs.
As per the typically trend trading strategy, traders take positions at Support and Resistance levels based on its overall trend.
In the following pin bar trading strategy, the same concept is applied in a much refined manner.
Live Chart Example
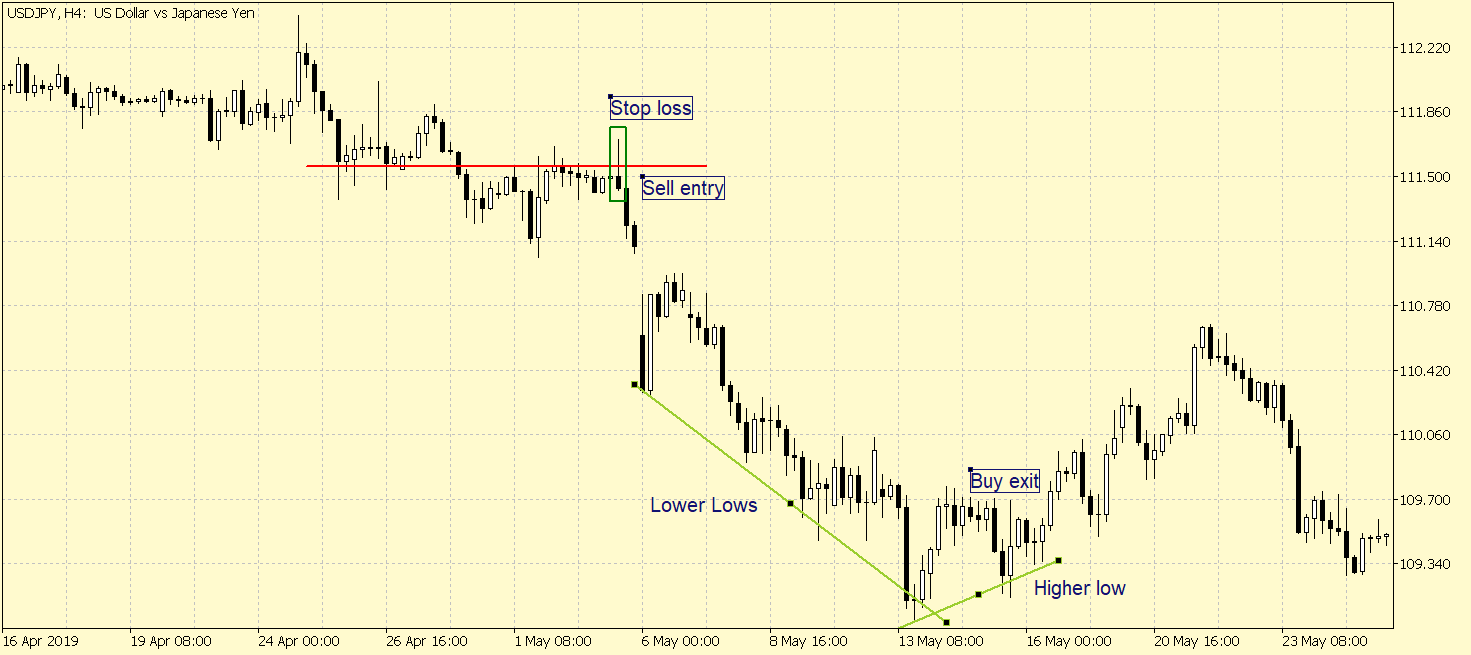
Below is the price chart of USD/JPY on the 4-hour time frame. Focusing the price from the left, the market that was moving sideways broke below and made a lower low. It was then followed by a lower high and a new lower low, implying that the market is in a downtrend.
After breaching through the red line, the market was held below the S&R successfully. Later, the buyers attempted to go above the red line (S&R) but got firmly rejected by the sellers, as signified by the wick on top. When the candlestick closed, it ended up as a pin bar. This confirms that the sellers are preparing to make new lows.
Thus, one can enter for a sell right after the formation of the bearish pin bar.
Take Profit
Since the market is in an evident downtrend, one can hold on to the positions until the lower low sequences turn into a higher low sequence.
Stop Loss
The stop loss for every bearish pin bar trading strategy must be above the high of the pin bar.
KT Pin Bar Indicator for MT4/MT5
We have a Pin Bar indicator available in our store that identifies the potential pin bar patterns. It can be applied to any instrument and time-frame.
Pin Bar Trading Strategy 3
Pin bars are an excellent tool for identifying reversals in the market. Here is a reversal strategy using the pin bar marked by our pin bar indicator.
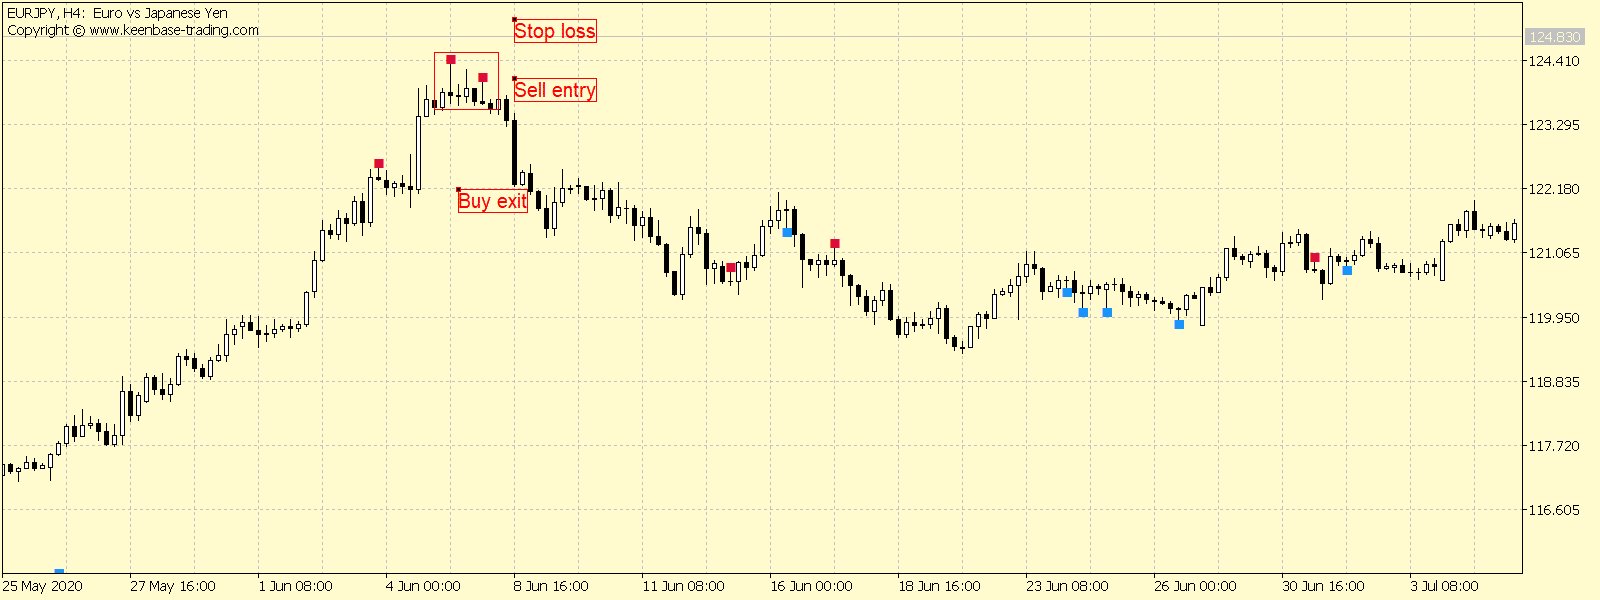
Consider the below chart of EURJPY on the 4-Hour timeframe. Beginning from 25 May 2020, the market started to trend up. By 5 June, it made a high to 124.410. Later, the momentum of the uptrend slowed down, which followed by a bearish pin bar. This implies that the bears are going to take over the market.
However, we do not open short positions quite yet. Even though the buyers are slowing down, it does not change the fact the market is still in an uptrend. Thus, for additional confirmation, we wait for another bearish pin bar to occur.
Once the second bearish pin bar shows up, traders can open short positions in the market.
Take Profit
To be on the safer side, the take profit can be kept right at the demand zone, as shown. And based on the strength of the down move, traders can alter their take profit accordingly.
Stop Loss
As mentioned earlier, since this is a bearish pin bar, the stop loss must be placed above the pin bar's high.
Conclusion
Similarly, every pin bar trading strategy explained above can be applied to the converse market as well. We hope you found the pin bar trading strategies exciting and informative. Happy trading!


