Understanding the ATR Bands Indicator
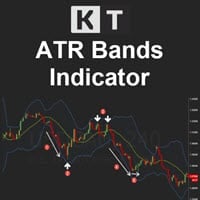
The world of trading is abundant with Forex indicators and tools designed to give traders an edge. One such effective tool is the ATR Bands indicator. A popular tool amongst traders, it brings a sophisticated approach to understanding market volatility.
We will discuss how to set up the ATR bands on your MT4/MT5, formulate an effective entry strategy, and set up crucial stop-loss and take-profit levels.
Theoretical Background of ATR Bands
ATR Bands, for Average True Range Bands, are volatility-based envelopes set above and below an asset's price on a chart.
Their calculation is based on the ATR, which measure volatility by decomposing the entire range of an asset price for a certain period.
Typically, the calculation of the ATR value is based on 14 periods.
Volatility refers to the rate at which the price of an asset increases or decreases for a set of returns.
It's a crucial aspect of market trading as it can indicate the trend's strength and potential reversals and signal optimal entry and exit points.
Manipulating the ATR Value and ATR Multiplier allows you to optimize the responsiveness of the ATR Bands Indicator to market volatility and price fluctuations.
This provides a steady measure akin to other volatility channels like the Keltner Channel.
Using the ATR Bands Indicator in Trading Strategies
Average True Range Bands can be used in various trading strategies.
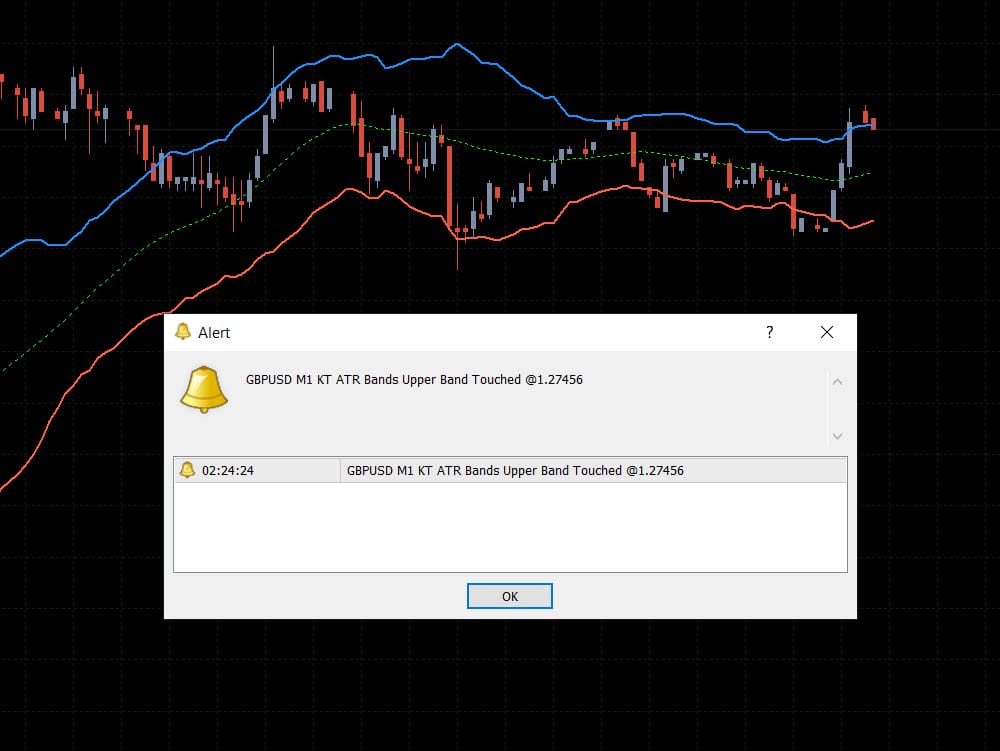
They're often utilized to confirm the validity of price breakouts, where a price breakout above or below the bands may suggest a continuation of the trend.
Here's a detailed strategy for trading Forex currency pairs using the Average True Range Bands indicator:
Set Up Your MT4 or MT5 With ATR Bands
The first step is to set up the Average True Range Bands on your MT4 or MT5 platform. Adjust the ATR Band settings to suit your trading style and timeframe.
Choose Your Forex Currency Pair
Next, choose the currency pair you wish to trade. Make sure it's a pair you're comfortable with and understand the dynamics.
Volatility can significantly vary from pair to pair, and understanding this can help you make informed trading decisions.
Identify the Market Trend
Before you make any trades, identify the current market trend. If the market is trending upwards (bullish), you'll look for buying opportunities.
If the market is trending downwards (bearish), you'll look for opportunities to sell.
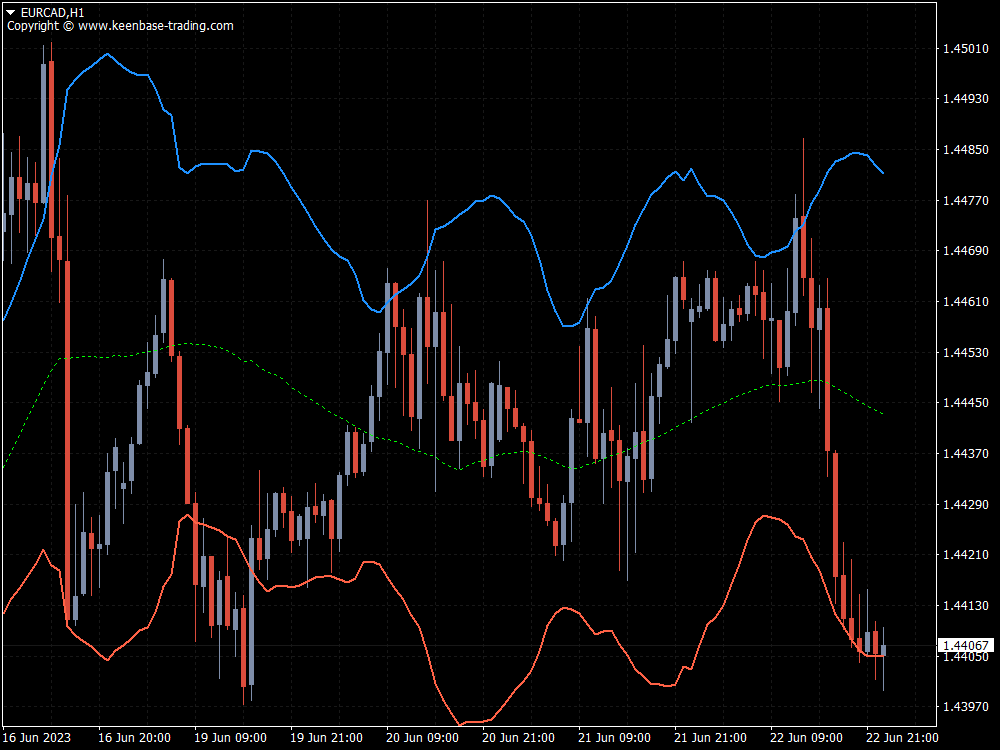
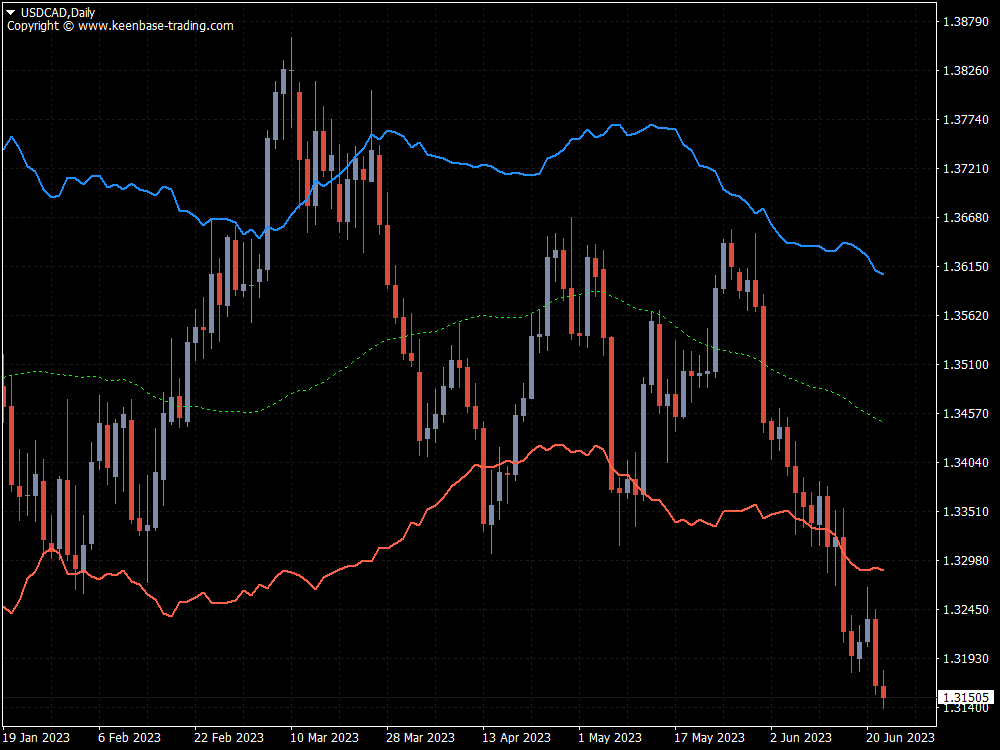
The Average True Range Bands can help with this. If the price is consistently near or above the upper band, it might be an upward trend.
Conversely, if the price is near or below the lower band, it could indicate a downward trend.
Entry Strategy
You will look for the price to break through the lower or upper band to enter a trade.
In an uptrend: Wait for the price to return to the lower band. This could be a good time to enter a buy trade when the price rebounds off the lower band.
In a downtrend: Wait for the price to rise toward the upper band. When the price begins to reject the upper band and falls, this could be a good opportunity to enter a sell trade.
This strategy assumes that the price will revert to the mean after a pullback in a trending market.
Set Your Stop Loss and Take Profit Levels
Setting stop loss and take profits correctly is key to managing your risk.
For a buy trade, consider setting your stop loss below the lower ATR band from where you entered the trade. Your take profit could be placed at the upper ATR band.
Set your stop loss above the upper ATR band from your entry point for a sell trade. The take profit could be set at the lower ATR band.
The rationale is that if the price breaks beyond the ATR Band opposite your position, it could indicate a reversal, so you would want to exit the trade.
Remember, this strategy should be used with other technical analysis tools for confirmation. It's always a good idea to practice and backtest any new trading strategy before implementing it in your live trading.
Also, each trade should only risk a small percentage of your total trading capital to ensure long-term sustainability.
How to Install the ATR Bands Indicator on MT4/MT5
Installing the Average True Range Bands indicator is straightforward. First, you'll need to download the Average True Range Bands Indicator file, which usually comes in a .ex4 format.
This file should then be copied into the "Indicators" folder inside your MT4/MT5 installation directory.
After restarting, the MT4/MT5 platform should display the ATR Bands Indicator in the 'Custom Indicators' section.
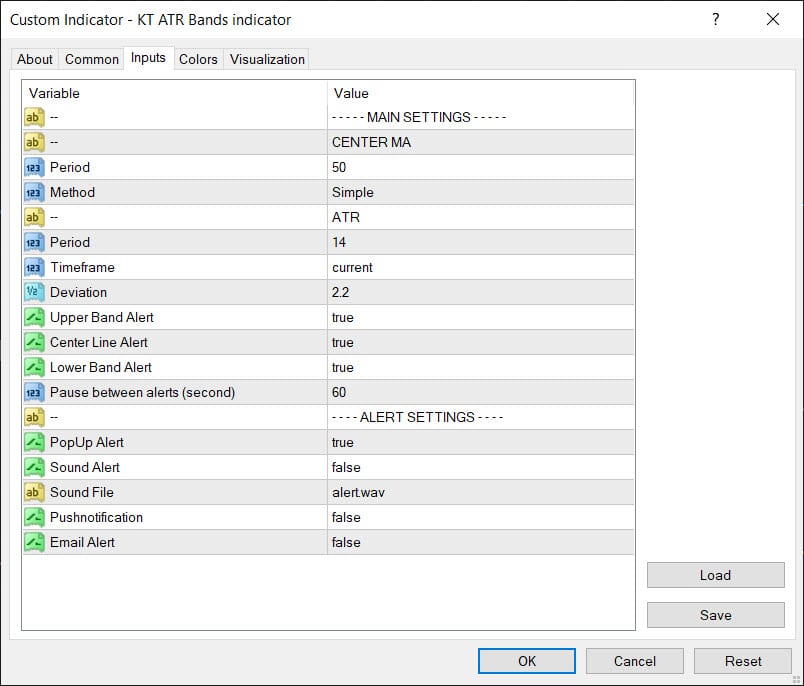
When applying the indicator, you can customize parameters such as period and multiplier.
The period defines how many bars the ATR calculation is based on, while the multiplier impacts the width of the ATR Bands.
Caution
You can find a few free download versions of this tool on the internet, but you must be careful using them. They often have many problems and are quite basic in what they can do.
Pros and Cons of ATR Bands Indicator
Average True Range Bands provide an edge by incorporating volatility into the analysis, offering dynamic support and resistance levels, unlike static ones supplied by other Forex indicators.
They can also act as an effective risk management tool, helping traders set stop loss and take profit levels.
However, like any tool, they have their limitations.
ATR Bands don't predict the direction of price movement and can sometimes give false signals in periods of extreme volatility.
It's often recommended to use ATR Bands with other credible indicators like MACD or Bollinger Bands to confirm signals.
Bottom Line
The Average True Range Bands Indicator offers a pragmatic approach to gauging volatility and market momentum.
Its ability to provide dynamic support and resistance levels makes it an indispensable tool for serious traders.
However, as with all tools, its usage should be well-understood and carefully applied within the broader context of a well-defined trading strategy.
