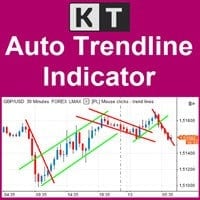
How Auto Trendline Indicator MT5 | MT4 Works
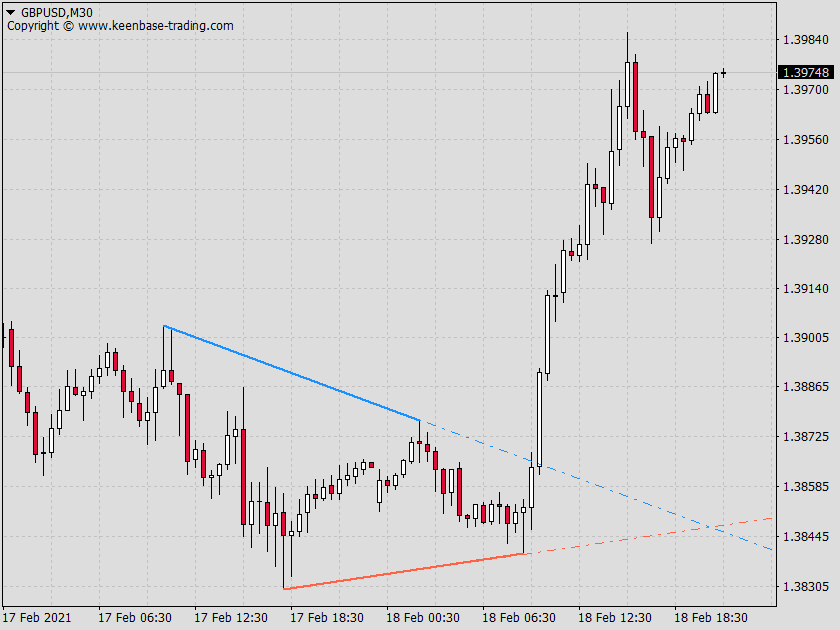
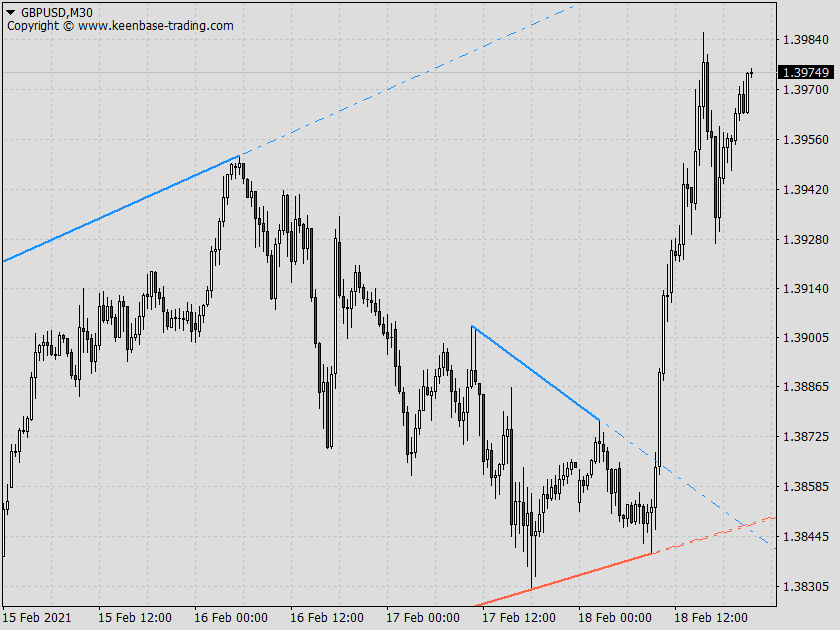
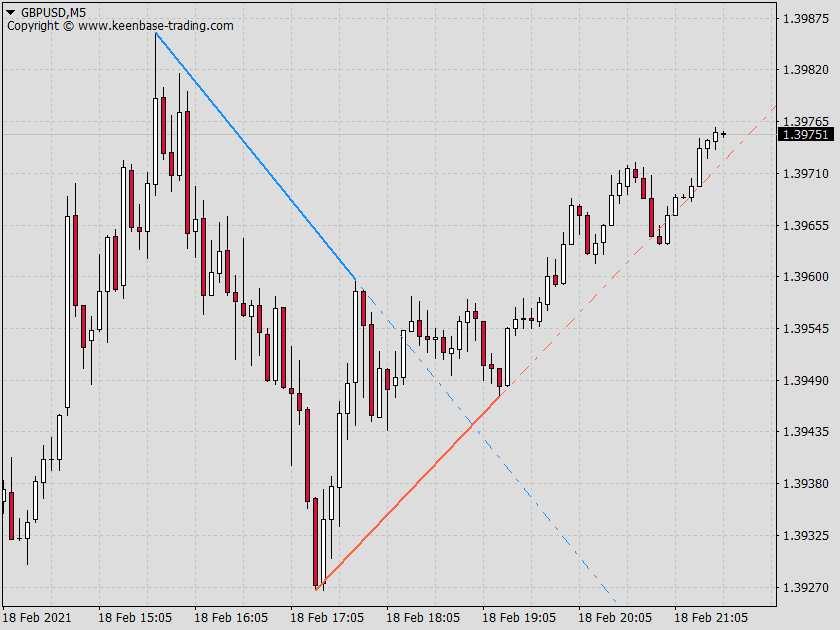
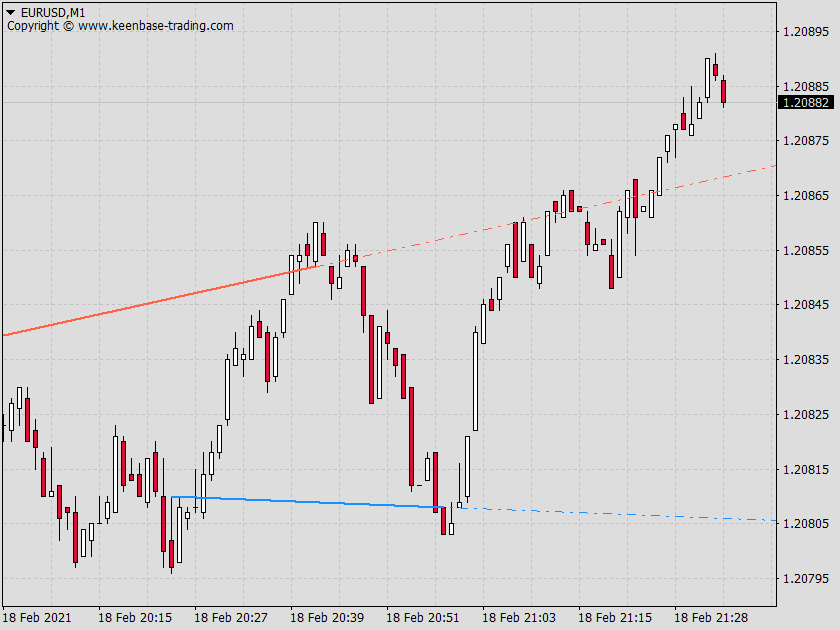
It uses ZigZag to fetch the chart’s upper and lower pivot points. Then, it interpolates the anchor points to draw the trend lines with their respective future projected rays using the fetched data. The indicator identifies possible trend lines and can project a predicted trend line based on historical data.
Trendline Sensitivity
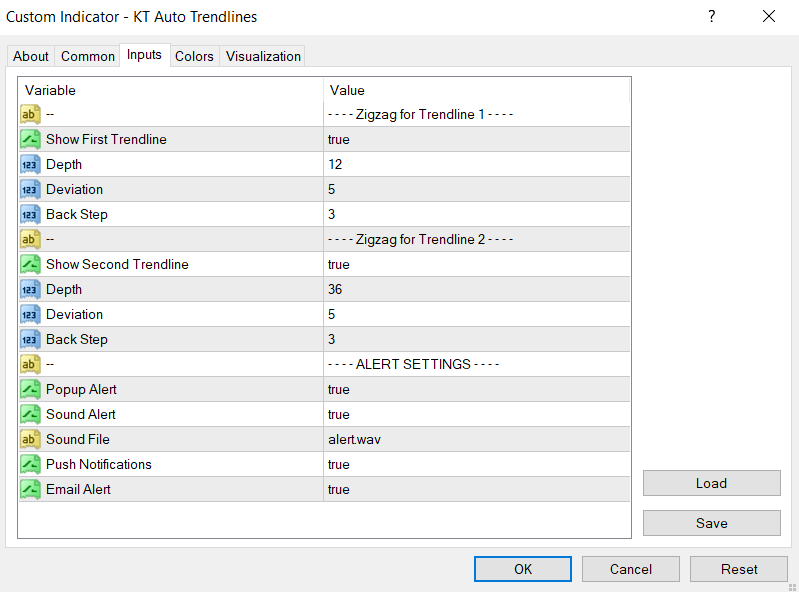
The auto trendline MT5 sensitivity depends on the chosen Depth, Deviation, and Back Step of the ZigZag. Widen trendlines work better in trending markets, while narrow trendlines work better in consolidated markets.
How to Trade with Trend Line Indicator MT4/MT5
A trendline is a diagonal line that connects two or more swing points in an upward or downward direction. It does not qualify as a trendline until the price tests the third point.
You can use the trendlines to find the area of support/resistance, breakouts, and reversals. Multiple trading systems can be designed by combining the trendlines with other indicators. Traders can use the corresponding trend line for setting stop-loss and take-profit levels, enhancing their trading strategy.
Additionally, trading trend line breaks can indicate a change in market trend and present an opportunity for profit.
Pros
- Trendlines can be used to identify the trend's direction in the blink of an eye. You don't have to depend on oscillators or moving averages to find the market trend.
- It works best to trade price action setups and candlestick patterns. For example, we can enter a buy trade when the pin bar pattern forms with a piercing wick of the bottom trendline or a sell trade when a shooting star forms at the top trendline (resistance trend line).
- Trendlines work exceptionally well for swing trading on Daily and Weekly time frames in the MT4 terminal.
Cons
- It's tough to automatically backtest the trading strategies on historical data that uses trendlines for trade entries.
- Trendlines can become cluttered and unorganized in a sideways market. It's best to use trendlines in a clear trending market.
- It's a well-known fact that the trendlines repaint, the future performance may not be as good as it seems. On the other hand, they look too good and accurate because the anchor points are often re-adjusted to the new data.
Effortless Chart Analysis with A Best Auto Trendline Indicator
Improve your trading system by integrating our auto trendline indicator, crafted to autonomously draw and update essential trend lines instantly. This brief overview will aid in grasping its capabilities, how it melds into your current trading practices, and its potential to refine your understanding of market trends.
The indicator can be used for technical analysis in the Forex market, adapting trend lines in response to price movements. Both novice and experienced traders will find the indicator and trading system helpful in understanding market trends and saving time in analysis.
Key Takeaways
- This indicator utilizes algorithmic calculations based on historical price data to automatically identify and adjust significant trend lines, which also serve as critical support/resistance levels, improving chart pattern recognition and trend analysis.
- Traders can use this indicator to enhance timing for trade entries and exits by buying at uptrend lines, selling at downtrend lines, or preparing for breakouts; the tool also features customizable settings for stop-loss and take-profit orders based on trend analysis.
- The indicator offers advanced customization options, such as color schemes and sensitivity adjustments for different trading styles and market conditions, making it suitable for novice and experienced traders.
Unlocking Chart Patterns with this Auto Trendline Indicator
Acting as a guiding tool for traders, this indicator performs the following functions:
- Pinpoints essential price points and prevailing trends.
- Assists in identifying patterns within charts.
- Transforms intricate market data into straightforward trend lines for more superficial interpretation.
The indicator is regularly updated to maintain its alignment with real-time market conditions. It incorporates historical pricing behavior when plotting trend lines, ensuring they are consistent with previous critical support and resistance levels.
It adjusts the incline of the trend lines in response to ongoing market shifts, offering accuracy and up-to-date relevance.
The Mechanics of Automatic Trendlines
This indicator utilizes algorithmic calculations and historical market data to identify price fluctuations. Recognizing these swings then constructs trend lines that mark the support and resistance levels.
As price movements create new highs and lows, the auto trendline adapts by recalibrating the slopes of its lines to reflect the latest market dynamics. This ensures that the trend lines displayed are precise and relevant to the current market conditions.
The indicator automatically updates to retain only the most exact trend lines, aiding traders in their analysis without requiring manual adjustments or distinguishing between different types of lines.
Enhancing Price Analysis with Trend Projections
It reveals existing market tendencies and focuses on what lies ahead. By adjusting the projection length setting, which determines how many bars a trend line is drawn into the future, traders can gain insight into potential extensions of current trends.
This feature allows users to tailor their view on forthcoming price interactions with these projected lines.
Trendline projections include both downtrend and uptrend outlines, providing traders with guidance for predicting upcoming zones of support or resistance—key elements when devising long-term trading strategies. Typically, if these dotted line projections stretch, they will.
Out it signifies robustness within the indicated trend, which might persist over time, thus offering more strategic depth from its corresponding tendance line (trend line).
Mastering Trades with the KT Auto Trend Line Indicator
Serving as a navigational tool, our auto trend line indicator assists traders in identifying prime entry points for trades. A straightforward approach is to initiate purchase positions when the price comes into contact with an uptrend line or to enter selling positions upon interaction with a downtrend line.
This indicator adapts dynamically, recalibrating trend lines automatically as fresh price data emerges. This ensures that traders have access to up-to-the-minute trend insights.
Utilizing this indicator also enables traders to execute risk management proficiently by targeting a risk-to-reward ratio of 1:3 for purchasing and offloading transactions.
Trade Entry: Spotting the Perfect Timing
Curious about identifying the ideal moments to enter trades? Our auto trend line indicator is your solution. This indicator assists in executing effective trades by signaling to buy when the price nears or making contact with the uptrend line and suggesting selling as it does with the downtrend line.
Setting up a one-cancels-the-other (OCO) order can help you navigate potential bullish and bearish breakouts within symmetrical triangles. With this approach, there’s no need for continuous chart surveillance because the auto trendline provides prompt notifications whenever the price intersects or reaches a predefined trendline.
Setting Stop Loss and Take Profit Levels
Establishing stop loss and take profit levels is fundamental to trading. Stop-loss orders minimize potential losses by closing a trade when the market moves against a trader’s position.
For price bounce strategies, stop loss orders can be effectively placed under the previous low sufficiently to prevent stopouts from false breakouts. Traders can draw trend lines to set effective stop loss and take profit levels, ensuring they align with market trends.
On the other hand, taking profit orders locks profits by automatically closing a trade when a certain price level is reached. The trend line analysis often determines these levels. Take-profit levels in a price bounce strategy can be set at the highest price within the trend or at a point that mirrors the height of the prior wave.
Regarding trend line breakouts, it’s strategic to place take profit orders at the highest price reached during the trend line breakout.
Customizing the KT Auto Trend Line Indicator Settings
This indicator doesn’t adopt a one-size-fits-all approach. Its advanced customization settings allow traders to manage base points and lines according to their trading style. According to the Auto Trendline Indicator's analysis, traders can filter the automated trend lines to show the most relevant, more lines, or all.
The color scheme of the indicator is also customizable, allowing traders to change the visual aspects of trend lines for better visibility. In addition, users can choose zigzag depth, deviation, and backstep.
The tool even allows users to set the minimum history depth required for channel formation, affecting the price history depth analysis for trend lines.
Personalizing Your Trading View
Imagine customizing your trading view to align with your unique style. With this indicator, you can! The color scheme of trend lines is customizable, ensuring they are evident and reading charts are comfortable for individual preferences.
The Auto Trendline Indicator offers the following features:
- Automatically sets the color of the trend lines to contrast with the background color of the chart, making them easily distinguishable.
- Adjusts channel colors to the chart’s background color to improve visibility.
- Allows customization of colors through the indicator’s settings.
Adjusting for Market Volatility
The Auto Trendline Indicator provides a versatile solution to handle fluctuations in market volatility by enabling users to tweak its settings for optimal performance.
By altering this tool's depth setting, traders can switch their analytical focus from short-term outlooks to long-range forecasts, aligning it with their respective trading scenarios.
An ‘Adaptive display algorithm’ feature is incorporated into this indicator that intelligently sifts through trend channels based on their relevance to your current time frame. This functionality proves exceptionally beneficial during times when market volatility spikes.
You have control over how the channel formation algorithm reacts. By adjusting its sensitivity, you can better manage how it responds to extreme price movements, which are commonplace under volatile trading conditions.
Real-World Application: Trading Strategies Using Auto Trendlines in the Forex Market
Let’s now explore the practical application of the Auto Trendline Indicator. Forex traders can leverage the tool to automate the drawing of trend lines on their charts, simplifying technical analysis.
The most suitable timeframes for optimal results range from M15 to H1, making it particularly effective for intraday and mid-term trading.
Two primary strategies can be adopted using the trend line indicator: capitalizing on price bounces from the price and trend line or trading on trend line breakouts.
The predictor feature of the trendline indicator even allows traders to anticipate market movements and strategically adjust their trades to follow the continuation of a trend.
Trading the Trend: Following the Line
Have you come across the saying “follow the line”? It embodies a simple yet potent strategy in trading. With the Auto Trendline Indicator, traders can wait for the price to retrace to an auto-drawn trendline, bounce off, and then enter a trade in the direction of the trend.
Here are some recommendations for placing orders:
- Buy Stop-loss orders should be placed under the previous low for buy trades.
- For sell trades, stop-loss orders are recommended to be placed above the previous high.
- Take profit can be set at the highest price in the trend or at a distance equal to the previous price wave’s height.
In trendline bounce swing trading, the following rules apply:
- Buy trades occur when the price touches an uptrend line.
- Sell trades occur when the price touches a downtrend line.
- Profit is often taken at the subsequent resistance level after a bounce.
Handling Trend Line Breakout
Breakouts often serve as significant turning points in trading. The Auto Trendline Indicator aids in preemptively identifying potential breakout areas, allowing for early action in response to a developing trend. It also helps traders discern between true and false breakouts, improving decision-making regarding trade entries.
Upon a confirmed breakout, the trader should buy if a downtrend line is broken with the price closing above it or sell if an uptrend line is breached with the price closing below it.
Regarding breakout trades, it is recommended that the stop loss be positioned below the lowest price within the trend line range and that the take profit order be placed at the highest price level achieved during the trend line breakout.
Indicator Suitability for Traders of All Levels
Count on our Auto Trendline Indicator as a steadfast companion if you’re starting to dip your toes into the trading waters or an experienced trader navigating the choppy market. It offers significant assistance to those new to trading by automatically plotting accurate trendlines and removing any element of speculation.
It’s not solely for newcomers. This indicator is designed to serve traders across all experience levels, with its capacity for automatic and meticulous drawing of trendlines. This gives every trader—from rookies to veterans—the edge they need to approach their trades confidently.
Summary
This indicator transforms intricate market data into accurate trend lines, which assists traders in recognizing chart patterns and analyzing price movements. Its adaptability to fluctuating market conditions and tailor-made settings make any trader’s toolkit essential.
It is equally beneficial for a novice trader embarking on their trading journey or a seasoned professional looking to sharpen their strategies. Seize the advantages of this indicator now to enhance your trades and mitigate risks with finesse!
Frequently Asked Questions (FAQs)
How does the KT Auto Trendline Indicator work?
This indicator uses algorithmic calculations alongside historical data to identify price fluctuations. These recognized movements are then applied to form trend lines that signify support and resistance levels.
Such an indicator aids traders in pinpointing effective potential points for entering or exiting trades by providing insights into these crucial areas established through trend lines.
How can this indicator help with trade entries?
Traders can utilize this trendline Indicator to make more informed decisions regarding when to enter a trade, as this indicator offers insights on optimal moments to buy and sell by highlighting trendline touches.
Can the Indicator settings be customized?
Yes, traders can customize the settings to manage base points and lines according to their trading style.
What strategies can be adopted using the Auto Trendline Indicator?
Employ this indicator to take advantage of price rebounds from the trend line or execute trades based on breakouts along the trend. Assess which approach aligns most effectively with your trading style.
Is this Auto Trendline Indicator suitable for novice traders?
Indeed, our trendline indicator is appropriate for beginner traders because it automatically draws accurate trendlines, thus removing speculation.


