Overview of the KT BB Squeeze Indicator
This indicator is a sophisticated technical analysis tool designed to help traders pinpoint potential trading opportunities by evaluating market conditions.
Rooted in the principles of Bollinger Bands and Keltner Channels, this indicator measures market volatility to provide a clear visual representation of current market dynamics. By doing so, it enables traders to make well-informed decisions, enhancing their ability to navigate the complexities of the Forex market.
Features of KT BB Squeeze Momentum Indicator
- Unlike other Forex indicators, this BB Squeeze indicator is light, full of features, and coded from scratch.
- It marks the potential entry points by placing vertical lines when the entry conditions match.
- Provide optimal results in every time frame.
- This indicator offers a more straightforward trading experience, with entry signals and trend assessment in the same indicator.
- All kinds of Metatrader alerts for entries and exits (fading momentum).
Input Parameters
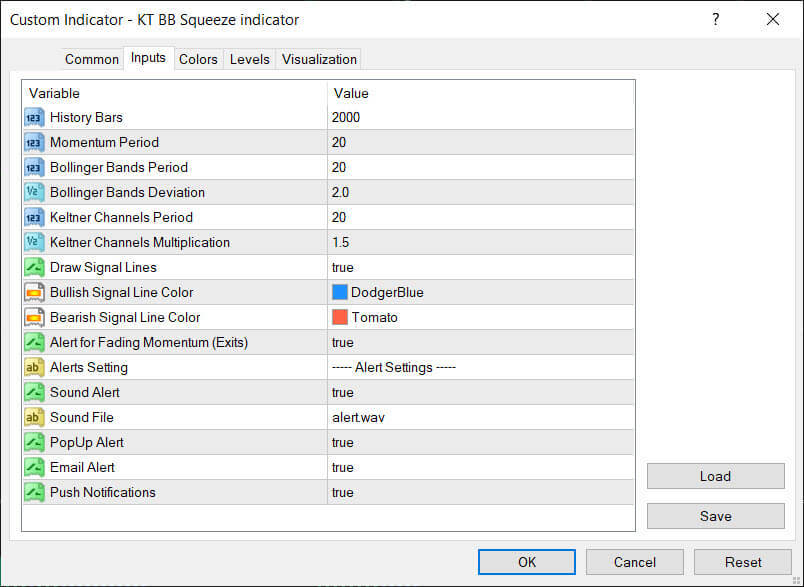
- History Bars: The number of history bars for the indicator calculation.
- Momentum Period: The period that decides the momentum detection.
- Bolling Bands Period: The period for the Bolling Bands calculation.
- Bollinger Bands Deviation: The standard deviations for the Bollinger Bands.
- Keltner Channels Period: The period to calculate the Keltner channels.
- Keltner Channels Multiplication: the multiplier for the Keltner channels. The Keltner Channels are influenced by the average true range, which helps define the boundaries of the channels by adjusting according to market volatility.
- Draw Signal Lines: If true, the indicator will plot the vertical line on each buy/sell signal.
- Alerts for Fading Momentum (Exits): If true, the indicator will send the alerts when momentum starts decreasing.
- The rest of the input parameters are self-explanatory.
Understanding the BB Squeeze Setup
Markets tend to move from a period of low volatility to high volatility and vice-versa. John Carter’s book Mastering the Trade reveals a simple way to determine volatility contraction (squeezing) and expansion using the Bollinger Bands and Keltner channels.
If Bollinger Bands are inside the Keltner channels, the market will likely be in a phase of the sideways market and low volatility. Conversely, if Bollinger Bands are outside the Keltner channels, the market will likely be in a trending and high volatility phase.
According to John Carter, The TTM squeeze happens in a sideways market when Bollinger Bands squeeze inside the Keltner channels.
A long breakout will likely occur when Bollinger Bands expand outside the Keltner Channels and the momentum value is above zero, indicating an uptrend in the market.
Similarly, a short breakout will likely occur when Bollinger Bands expand outside the Keltner Channels and increase momentum with a Downtrend in the market. Sell signals are generated when the momentum oscillator is below the zero line, indicating a downtrend in the market.
Using this methodology, we can go long when Bollinger Bands come out from Keltner channels and the momentum oscillator is above the zero line. Similarly, we can go short when Bollinger bands come out from Keltner channels and the momentum oscillator is below the zero line.
- The gray dots represent the period of low volatility when Bollinger Bands are inside the Keltner channels. The gray dots signify low volatility, indicating that the market is preparing for a significant price movement.
- The white dots represent the period of high volatility when Bollinger Bands are outside the Keltner channels. The appearance of white dots represents a squeeze release, suggesting a potential explosive move after a period of low volatility.
Understanding the Bollinger Bands
It’s one of the widely used indicators that helps with the technical analysis by Forex traders. John Bollinger developed the Bollinger Bands indicator in the 1980s. It comprises three lines in which the middle line is a 20 periods simple moving average.
The upper band is two standard deviations from the moving average, while the lower band is two standard deviations from the moving average. The Bollinger Bands work in conjunction with the Keltner Channel indicator to identify periods of low and high volatility.
Source: Bollinger Bands Trading Strategies.
Pro-Tips to Avoid the False Signals
- Remember that the indicator is heavily dependent on Bollinger on Bollinger bands and is therefore susceptible to fake breakouts or head fakes.
- Combining the price action, candlestick patterns, and support/resistance level with the BB Squeeze breakout is best to increase its success rate.
- It also comes with some other names like Squeeze Pro or Squeeze Momentum indicator MT5, which is essentially the name of the same indicator.
How the KT BB Squeeze Indicator Works
This indicator operates by merging the insights from Bollinger Bands and Keltner Channels to detect periods of low market volatility. When the Bollinger Bands are positioned within the Keltner Channel, it signifies a phase of low volatility, signaling a potential trading opportunity.
The indicator also incorporates a simple momentum indicator to ascertain the trade direction. Carter suggests waiting till the first gray cross after a black cross to take a position in the direction of the momentum, ensuring a strategic entry point.
Benefits and Limitations
The KT BB Squeeze Indicator offers several advantages to traders, including:
- Clear signals for volatility shifts: The indicator provides explicit visual cues for transitions from low to high volatility, enabling traders to anticipate potential breakouts.
- Dual-indicator system: By combining Bollinger Bands and Keltner Channels, it offers a comprehensive view of market momentum and volatility.
- Anticipation of major moves: The indicator excels in predicting significant price movements following consolidation phases, helping traders capitalize on major market shifts.
However, the indicator also has some limitations, such as:
- False signals: In highly volatile or sideways markets, the indicator can generate false signals, potentially leading to losses.
- Lagging nature: As a lagging indicator, it might result in delayed entries, causing traders to miss optimal trade points.
- Over-reliance risk: Sole reliance on this indicator without confirmation from additional analysis can lead to misinformed trading decisions.
Conclusion
The KT BB Squeeze indicator is a powerful tool for traders aiming to identify potential trading opportunities in the Forex market. By integrating Bollinger Bands and Keltner Channels, the indicator provides a clear visual representation of market conditions, facilitating informed trading decisions.
However, to maximize its effectiveness, it is crucial to use the indicator in conjunction with other Metatrader indicators and to be mindful of its limitations. This balanced approach will help traders navigate the Forex market more effectively, leveraging the strengths of this indicator while mitigating its potential drawbacks.


