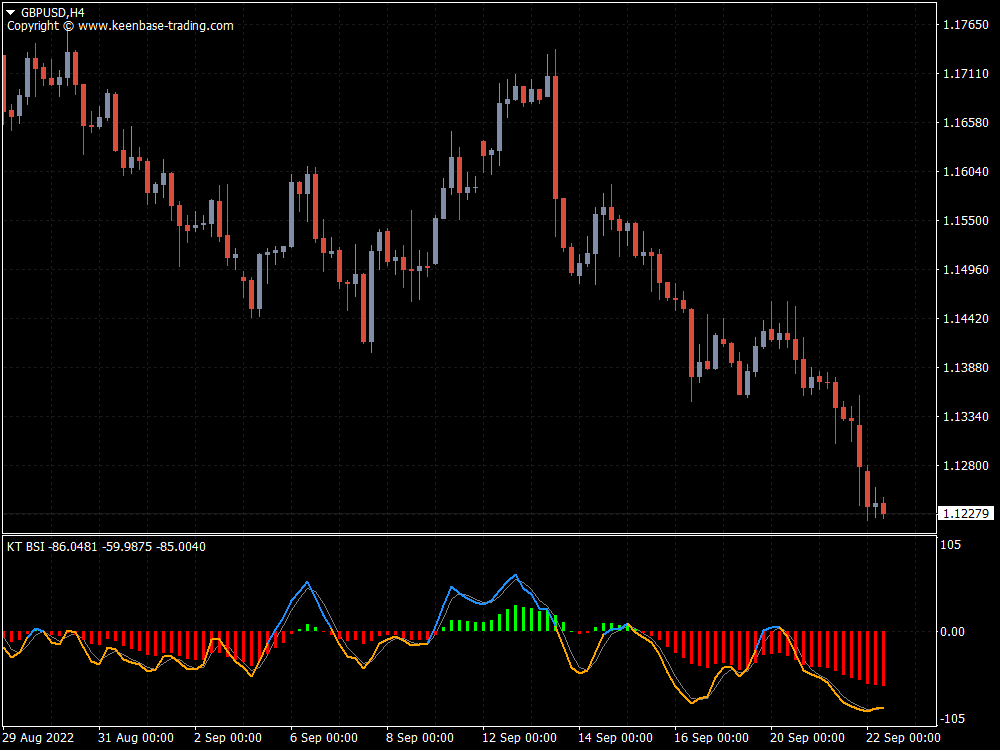
The Bar Strength Index (BSI) is derived from the Internal Bar Strength (IBS) indicator, which has been successfully applied to many financial assets such as commodities, crypto, indices, and the stock market over the last thirty years.
Investors can use the IBS indicator to sell positions on strengths and buy positions on weaknesses. It's based on the following formula:
IBS = (close – low) / (high – low) * 100
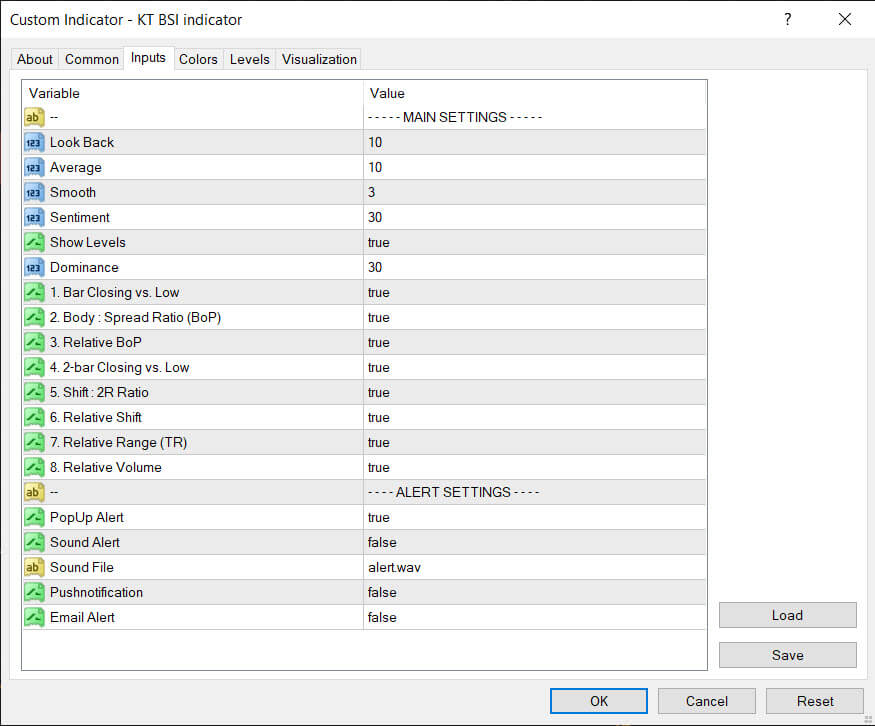
Inputs
How to trade using the BSI indicator
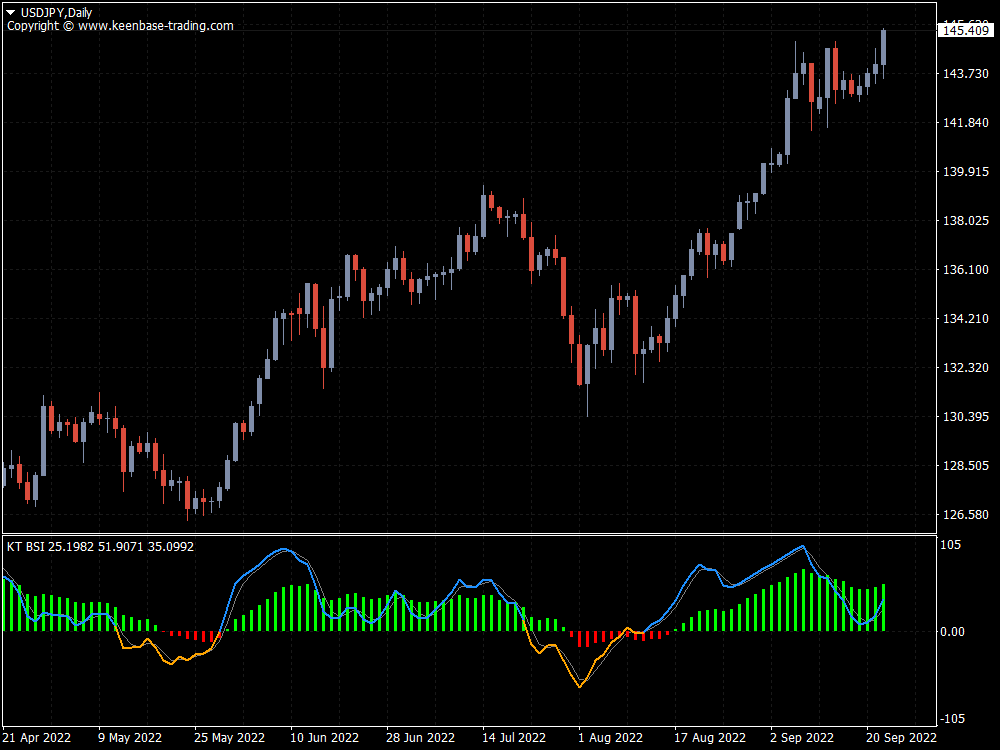
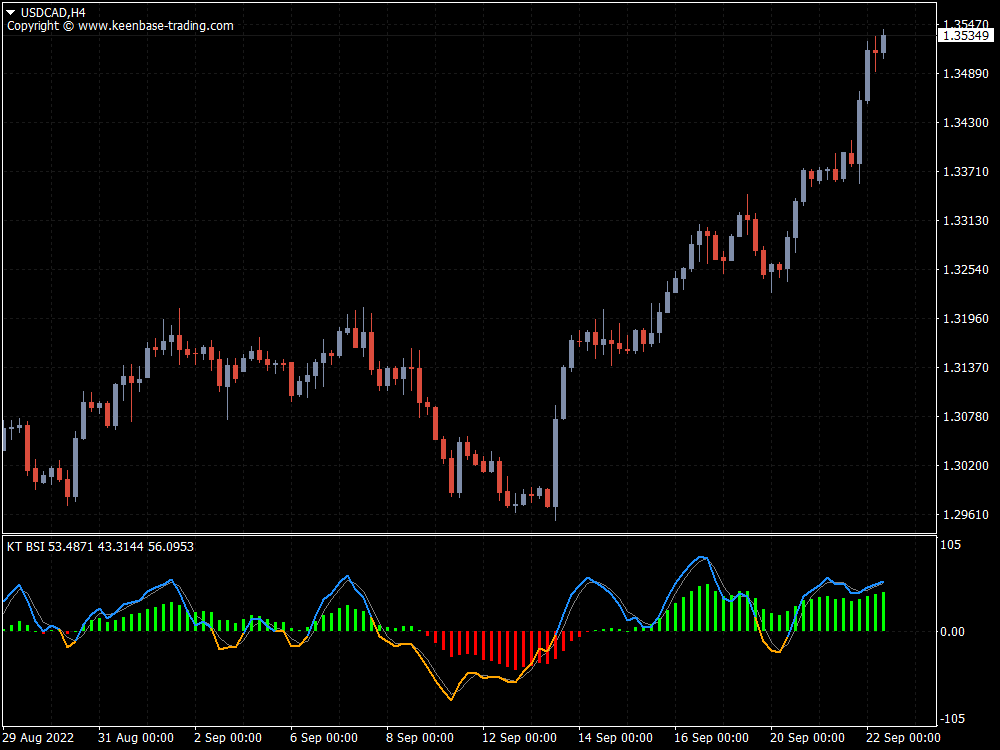
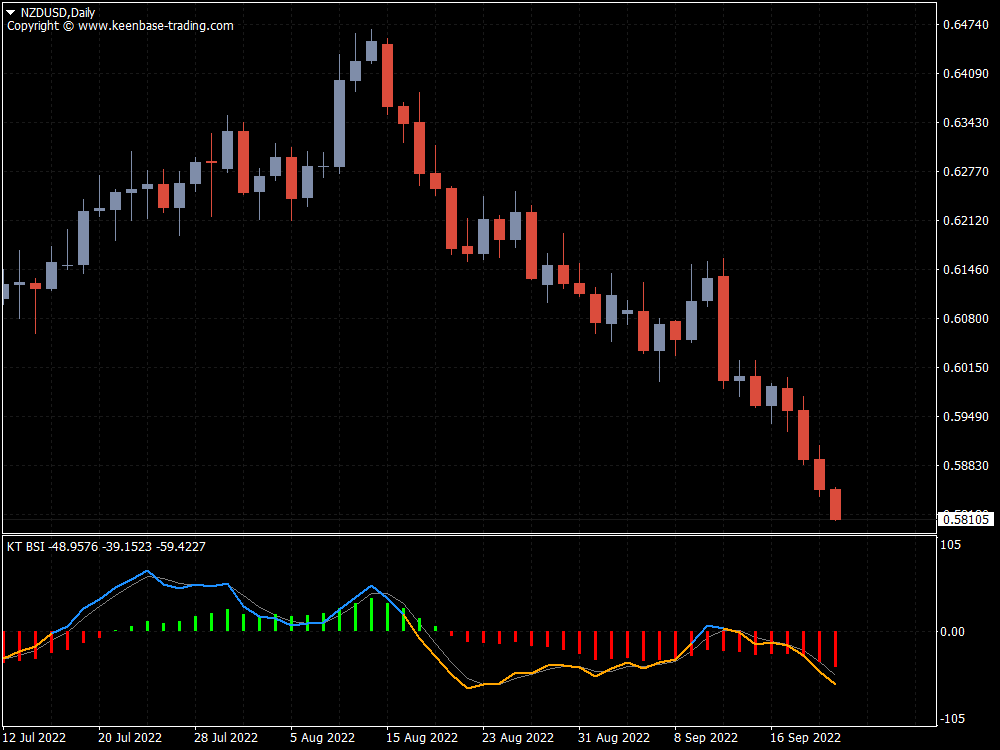
BSI works best on higher time frames, such as daily. This is because it has an upper green zone level and a lower red zone level, which indicate extreme strength and decreasing strength in the asset price, respectively.
The BSI dynamic line reaches those levels in response to market conditions and participant actions. This indicator can be used independently to generate trade ideas or in conjunction with other technical indicators and tools to determine the most promising trading positions.
Some Examples of BSI Trading Strategies
Buy Entry
- Parabolic dots appear beneath price candles and begin to form a series.
- The volume indicator indicates that the asset price is under increasing buying pressure.
- The BSI dynamic line is in or near the red zone, indicating a lack of strength.
Buy Exit
- On the upside of price candles, the parabolic SAR dot activates.
- The volume indicator indicates that sell pressure is increasing.
- The BSI dynamic line drops in the red zone, indicating that strength decreases after reaching the green zone.
Sell Entry
- Parabolic dots appear above price candles and begin to form a series.
- The volume indicator indicates that the asset price is under increasing selling pressure.
- The BSI dynamic line is in or near the red zone, indicating a lack of strength.
Sell Exit
- On the downside of price candles, the parabolic SAR dot activates.
- The volume indicator indicates that buy pressure is increasing.
- After reaching the green zone, the BSI dynamic line drops into the red zone, indicating a decrease in strength.
Pros and cons
Pros
- It works well on various trading assets for both technical analysis.
- The indicator is a simple-to-use indicator.
- It can suggest short-term and long-term trades.
Cons
- The BSI indicator can fail for fundamental reasons and during consolidation periods.
- It does not provide precise entry/exit points for trades.
- It requires combining it with other indicators necessitates complete trade setups.
- Some free bsi indicator is available on the internet, but they are usually not up to the mark and are full of bugs, as checked by our team.
What is BSI in Trading?
In trading, BSI stands for Bar Strength Index. It is an indicator that evaluates price data and provides insights into the strength and weaknesses of a financial asset. It can be also used to predict future market behavior.
The BSI is calculated based on the Internal Bar Strength, which measures the ratio of the distance between the closing price and the low price to the distance between the high and low prices.
What is BSI Short Term Trend?
The BSI can be used to identify and analyze the short term trend switches. Traders may use the BSI to determine the momentum and direction of the price movement in the near term.
We do not recommend finding the long term trend shifts with BSI as its calculation and methodology are more suitable for short-term trend findings.


