Exploring the KT Buy-Sell Volume Indicator
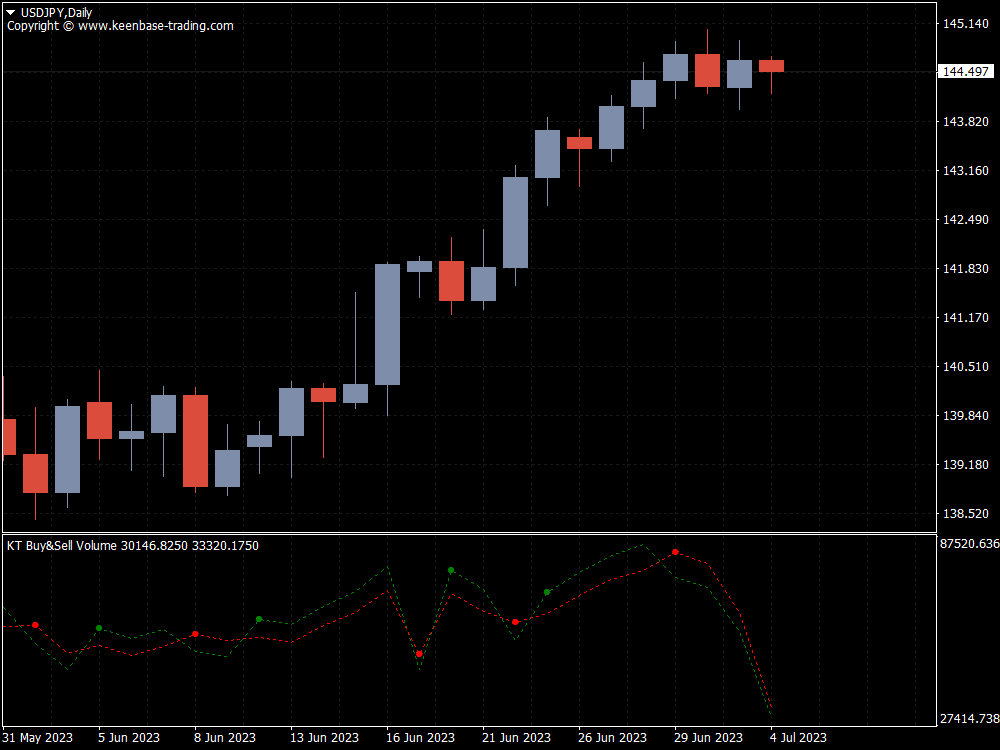
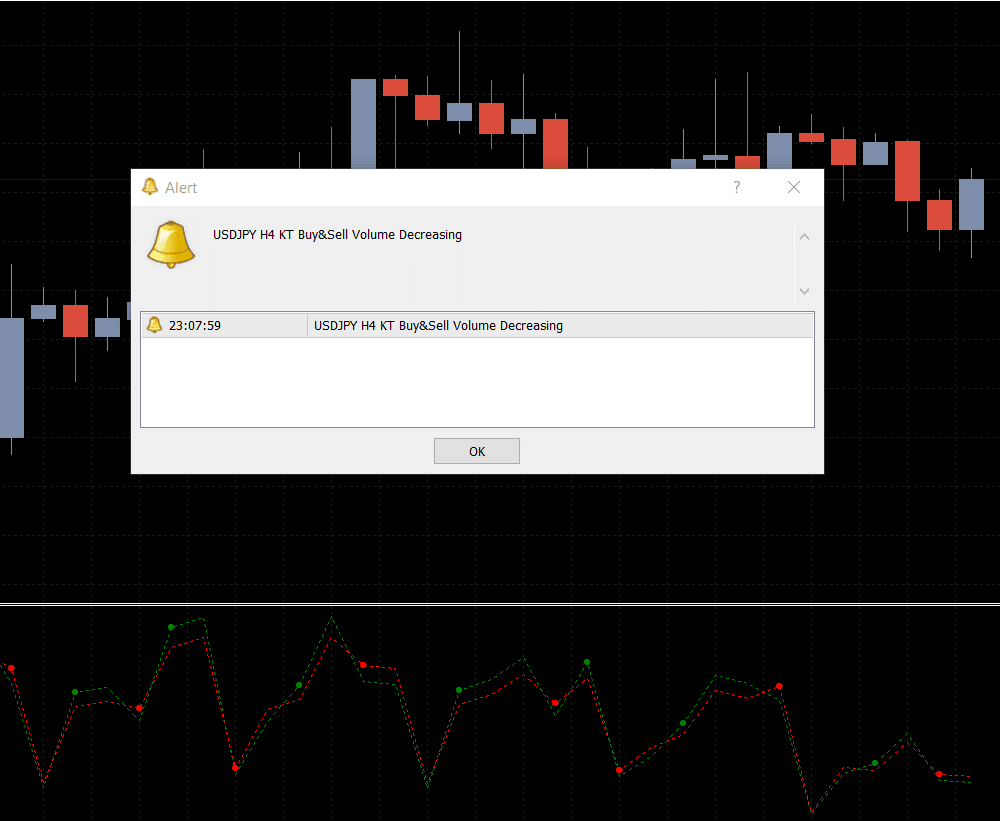
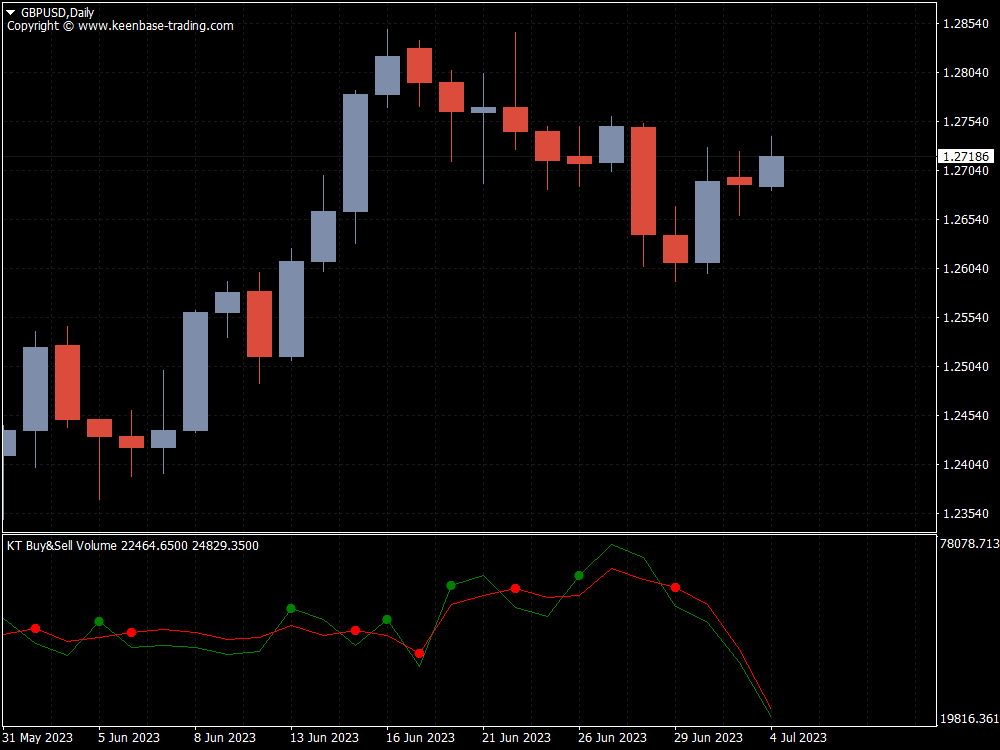
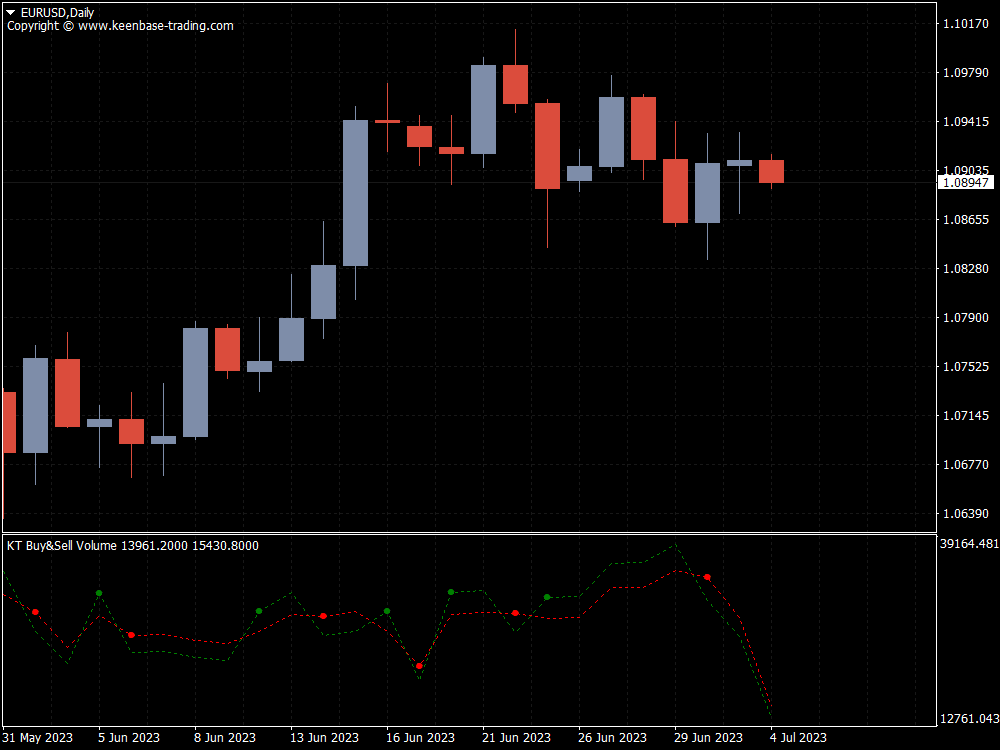
Let's delve deeper into how to trade using the Buy-Sell Volume indicator, specifically on the MetaTrader 4/5 platform. The KT Buy-Sell Volume indicator uses a dotted curve that undulates to show the fluctuations in market volume.
The curve changes color, too, acting as a visual representation of bullish and bearish momentum. When the volume rises, the curve turns green, signaling a potential bullish move.
Conversely, when the trading volume decreases, the curve turns red, implying the market might be setting the stage for a bearish move.
How To Trade Using The KT Buy-Sell Volume Indicator
Consider an example where we examine a consolidation period of the GBPUSD pair on a 60-minute chart.
Let’s say the pair was riding a bullish wave. The sideways market that follows this bullish move is typically seen as a pause before the next leap - which we anticipate to be another bullish breakout.
During this consolidation, the buy-sell volume curve was also in a holding pattern, oscillating within a narrow range.
However, as soon as the GBPUSD attempts a bullish breakout, the volume curve of the Indicator responds. It climbs, moving above its recent range, and turns green.
This color change is the indicator's way of affirming that the breakout is supported by a strong, positive volume force, a sign that the bullish trend may continue. This easily helps you in identifying the buy setups.
The same can be done to determine short positions. When the volume curve turns red and exhibits a decreasing pattern, it signals a potential bearish breakout.
Ideally, a selling opportunity presents itself when the price makes a bearish breakout, and the volume concurrently decreases.
This versatile indicator doesn't just identify breakout opportunities; it also helps in recognizing trend-following trade setups.
Suppose the price is in a bullish trend and forms a higher low before resuming the current bullish move.
If the volume curve turns green and rises simultaneously, the asset is under considerable buying pressure - a strong signal to enter a long position.
The KT Buy-Sell Volume indicator - a potent tool in your trading arsenal, helping you decipher the strength behind price movements, whether anticipating breakouts or following trends.
Armed with these volume indicators' signals, you can navigate the financial seas more confidently.
Trading Volume Lines
The volume indicators normally show the volume data as color-coded bars to indicate buying or selling pressure.
For instance, a green bar would represent a higher buying volume, and a red bar would denote a higher selling volume.
But this indicator presents the buy and sell volumes as separate lines rather than bars. This can provide a clearer visual comparison of buying and selling activity.
Aggregated Volume
The Buy Sell Volume Indicator can also display the cumulative or running total of buy and sell volumes over a certain period. This can help you identify dominant market trends.
Volume Oscillator
The indicator includes an oscillator that measures the difference between a short-term volume moving average and a long-term volume moving average.
This oscillator can help identify potential reversals or changes in market sentiment.
Volume-based Signals
The KT Buy Sell Volume Indicator will provide signals based on specific conditions, such as when buying volume significantly exceeds selling volume (potentially indicating an upward price move) or vice versa.
Pro-Tips to Use KT Buy Sell Volume Indicator
Use It In Conjunction With Price Trends
The KT Buy Sell Volume Indicator becomes particularly useful when you analyze it alongside the price action.
For example, if the price rises and the market sees an increased volume, it suggests a strong upward trend.
However, if the price is rising, but the market volume is decreasing, it might indicate that the upward trend is losing steam, and a price reversal could be imminent.
Watch For Divergence
Divergence occurs when the price of an asset and an indicator move in opposite directions.
For instance, if the price is making higher highs, but the Buy Sell Volume Indicator is making lower highs, it could suggest that the upward trend is not backed by strong volume, and a price reversal might be near.
Look At Extreme Volume Spikes
A sudden spike in buying or selling volume could indicate strong market interest and a possible start of a new trend.
However, extreme volume spikes could also represent overbought or oversold conditions and might precede a market reversal.
Combine It With Other Indicators
The KT Buy Sell Volume Indicator is powerful but should not be used in isolation.
It can be especially effective when used in combination with other indicators.
For example, using it alongside moving averages can help confirm trend changes, or combining it with a momentum oscillator like the Relative Strength Index (RSI) can provide additional confirmation for entry or exit signals.
Use It To Confirm Breakout/Breakdown
If a price breakout or breakdown occurs on high volume, it usually suggests a real and strong move.
Conversely, a breakout or breakdown on low volume might be a false signal.
Volume Calculation Method
Your volume calculation method significantly impacts the insights you gain from the volume indicator.
For instance, if you use tick volume, which counts the number of price changes rather than actual transacted volume, you may receive a different perspective than someone who uses real volume.
Real volume, which measures the number of shares or contracts that change hands, could be more precise.
Hence, choosing between these methods would affect your understanding of market liquidity and activity.
As the real volume data is often not provided by most of the Forex brokers, our indicator uses tick volume instead of real volume.
Color Settings
Customizing the colors to represent buying and selling volume can help you quickly identify which type of activity dominates at a given time.
This can expedite decision-making during fast-moving markets and help keep a clear perspective on market dynamics.
Pairing This Indicator With Volume Weighted Average Price
As discussed, the Buy Sell Volume Indicator measures a market's buying and selling activity.
This activity can be visualized through color-coded bars or curves representing selling volume, such as the red volume curve in your paragraph.
The selling volume can provide valuable information about market sentiment.
If the red volume curve dominates, it may indicate a bearish market with strong selling pressure.
On the other hand, the VWAP is a benchmark used to determine the average price a security has traded at throughout the day, taking into account both volume and price.
This benchmark is essential in understanding the actual average price of a security.
The Buy Sell Volume Indicator and the VWAP can provide a comprehensive picture of market dynamics.
For example, you might look for instances with a high selling volume (a prominent red volume curve). Still, the VWAP remains stable or increases, suggesting that despite the selling pressure, there is enough buying volume at higher prices to keep the average price up.
This could signal a bullish trend, and a trader might decide to enter a long position.
So, in essence, the Buy Sell Volume Indicator and VWAP are complementary tools, with the former providing a visualization of buying and selling pressure and the latter offering a volume-based average price for more informed trading decisions.
