Working with the Displaced Moving Averages (DMA)
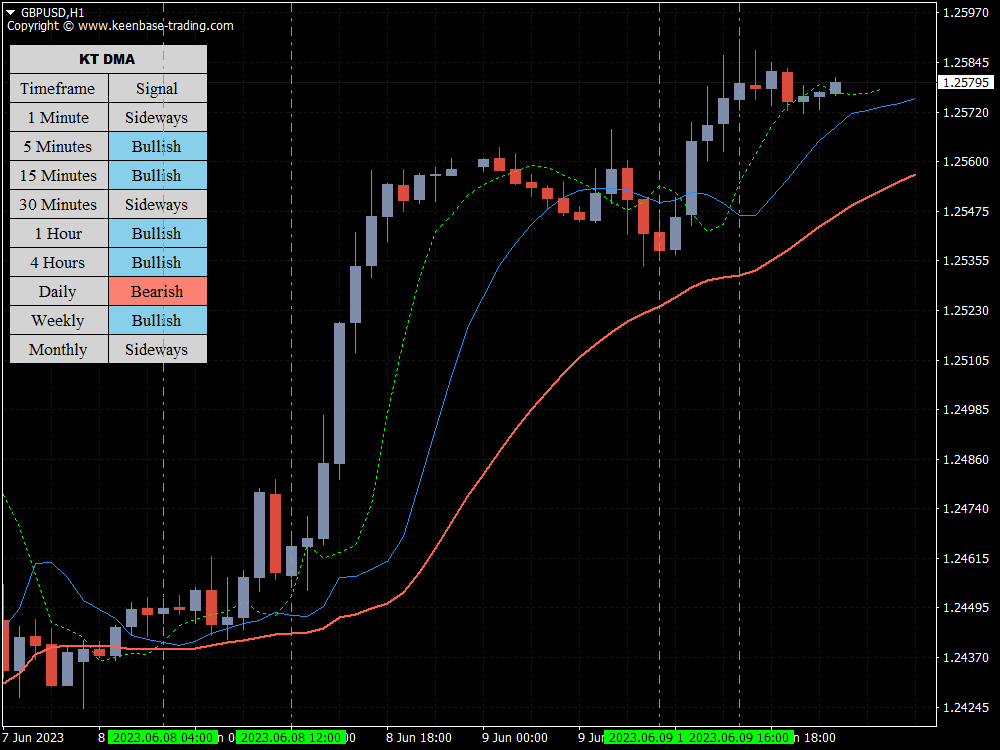
A positive displacement of a moving average causes it to move to the right, which means the MA is displaced forward.
The moving average can also be pushed backward in time, a process known as negative displacement, which shifts the MA to the left.
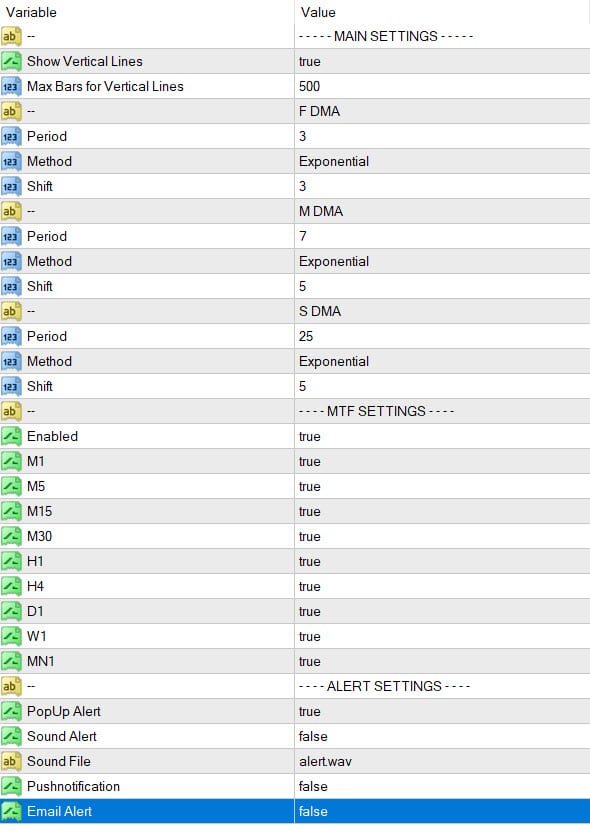
Every moving average value is advanced or retracted by the number of periods that the trader chooses.
Let’s say you want to move the moving average three periods forward. On the chart, the current MA value will be positioned for three periods in the future.
Three periods will also be added to the value from the previous historical period, and so forth. It is a literal shift of the moving average line.
Various Uses of the Displaced Moving Averages Technical Indicator
The DMA performs all the functions of a typical MA.
But occasionally, it might act more effectively since it can be better tailored to the asset being traded.
Current Trend
The DMA generally aids in identifying trend direction.
It helps signal an uptrend or that the price is above average when it is above the MA.
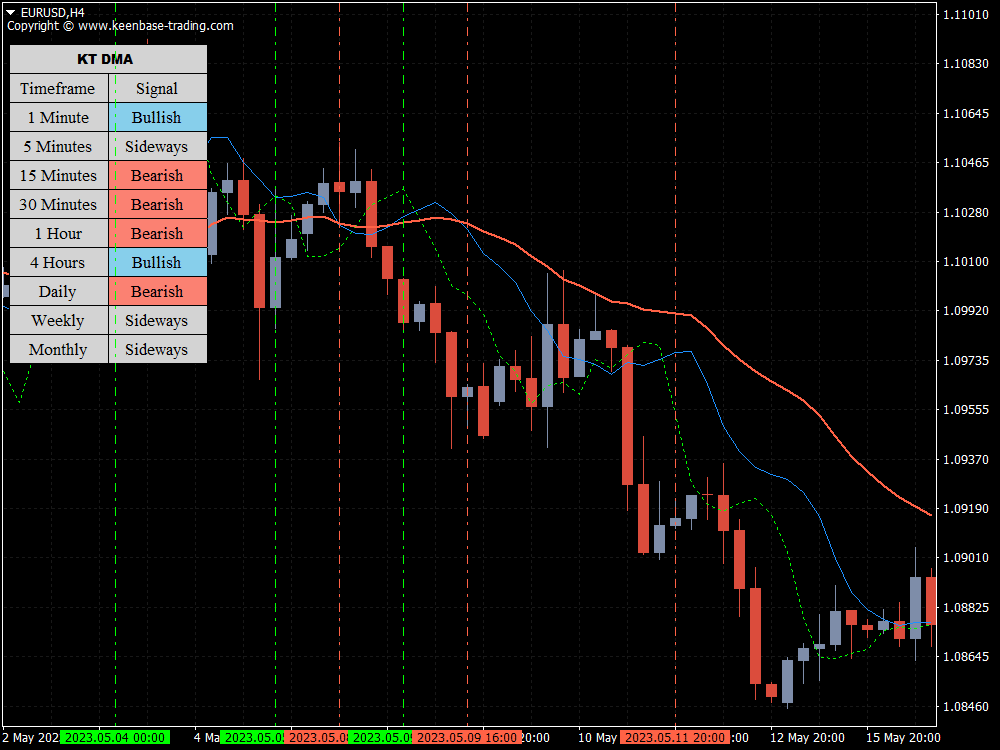
In contrast, when the price is below the MA, it is below average, which indicates that a decline is underway.
In the meantime, if the price crosses the MA, it can mean that the trend is shifting.
A downtrend may begin if the price breaks through the moving average from above, indicating that the uptrend has ended.
Support and Resistance
A DMA can assist in locating both support and resistance. As was said before, the MA can align with the price during an upswing so that previous pullback lows align with the MA.
The same idea holds for downward trends.
The DMA is changed to match the pullback highs during the downtrend.
Correlation Analysis
The displacement feature of the moving averages can be used to analyze cause-and-effect correlations between different technical indicators.
You can analyze the correlation between oil prices and oil and gas stocks to predict better when companies' stock prices will rise following changes in the commodity market.
How to Decide on the Displacement Shift
You must experiment with your displacement shifts and see what works with your trading strategy.
Given the lagging characteristics of moving averages, most people use a slight negative displacement to correct for the lag.
Specific Examples of DMA Settings for Different Types of Trends
Short Term Trends
The trend can last from a few days to 3 weeks. You use 20 DMA or a combination of 4, 9, and 18 DMA.
Intermediate-Term Trends
This trend lasts for a period of 3 weeks to 3 months. Some people call it a secondary trend.
We can use the combination of 13 and 30 weeks DMA. This may be useful for swing Forex traders.
Long-Term Trends
Any trend that lasts for six months or above can be considered a long-term trend.
We can use 50 and 200 DMA (days) to understand the long-term trend's direction.
Limitations of the Displaced Moving Average Indicator
You cannot entirely depend on any MA, even one displaced, for accurate prediction; other factors must also be checked.
Consider combining the DMA with candlestick patterns or EAs to add confluence signals in your trading.
Conclusion
A displaced moving average shifts forward or backward an MA. This can have many uses, specifically in correlation analysis.
Using the displaced moving averages with supporting signals, such as candlestick patterns, can increase the odds of reliable entries in your trading strategy.


