What is the Donchian Channel Indicator?
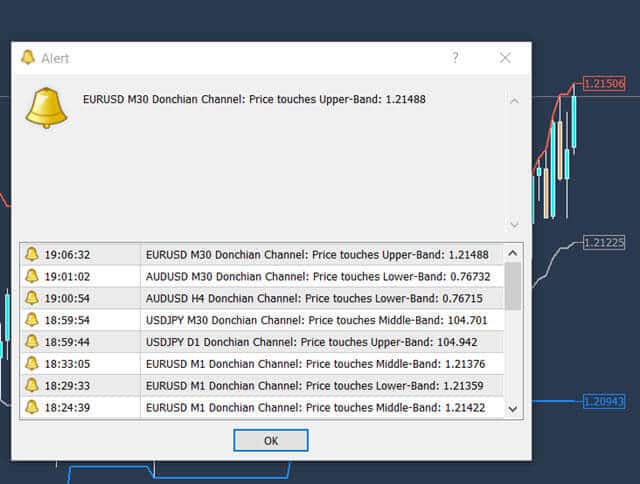
The Donchian Channel Indicator is a popular technical analysis tool used in market trading to identify trends and potential trading opportunities. Developed by Richard Donchian, this classic indicator is based on the concept of a channel formed by the highest high and lowest low of a currency pair over a specified period.
The Donchian Channel Indicator has been widely used by traders for decades, providing a reliable method to analyze market trends and make informed trading decisions.
By tracking the highest and lowest prices over a set period, the indicator helps traders visualize the market’s volatility and potential breakout points, making it an essential tool in any trader’s arsenal.
Settings and Installation
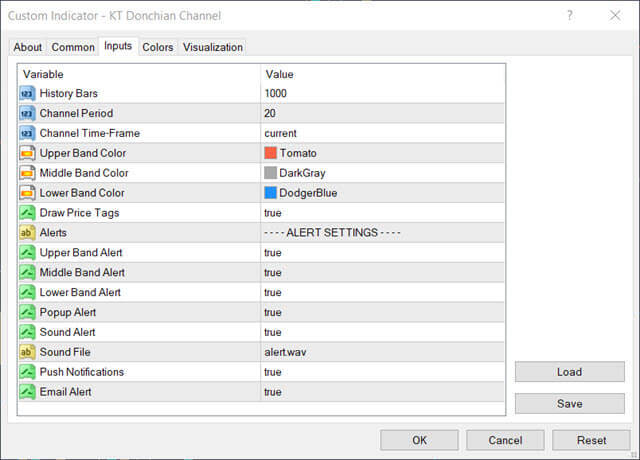
To use the Donchian Channel Indicator, you need to install it on your MetaTrader platform. The installation process is straightforward and can be easily completed by downloading the indicator from My-Downloads. Once installed, you can adjust the settings to suit your trading needs.
The indicator offers several customizable settings, including the period of calculation, which determines the number of bars used to calculate the channel. Additionally, you can modify the color and style of the channel lines to match your preferences, ensuring that the indicator integrates seamlessly with your trading charts.
This flexibility allows you to tailor the Donchian Channel indicator to your specific trading strategy and visual preferences.
Difference between Donchian Channel and Bollinger Bands
Bollinger Bands are created using a simple moving average calculating for n period plus/minus the price's standard deviation. In contrast, Donchian channels are created using the highest-high and lowest-low over the last n period. By the way, both indicators are available on most trading platforms.
Calculation and Components of the Donchian Channel MT4 and MT5
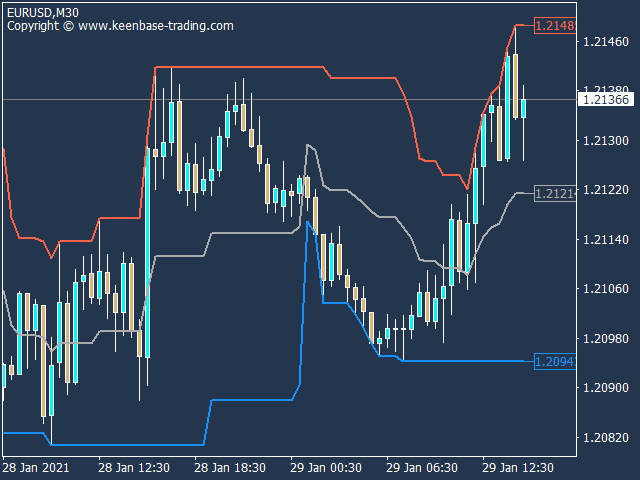
Donchian channels consist of three lines: an upper band, lower band, and middle band. The upper/lower bands are simple moving averages (SMAs) of the highest and lowest prices over the past 20 days.
The center line is an SMA of the high and low prices over the same period divided by 2. The mid line determines the trend direction based on whether the price action is above or below, and it helps visualize the volatility of market prices, providing signals for potential trading positions.
Here is the formula for each band (n can represent minutes, hours, days, etc.):
- Upper band: Highest high in previous n periods
- Lower band: Lowest low in previous n periods
- Middle line: [(upper band – lower band)) ÷ 2)]
The Donchian Channel Indicator is similar to Bollinger Bands, except it doesn’t contain standard deviations in its formula. This tool is versatile as you can use it for false breakouts, stop loss trailing, trend following, and reversals. The 20-day Donchian channel is widely used in the financial markets.
History
In 1983, Richard Dennis and William Eckhardt, legendary commodity traders, conducted a famous experiment to prove that they can make any person keen to learn a consistently profitable trader.
A bet between the duo inspired the whole experiment; Dennis believed anyone could be taught how to trade. Eckhardt believed that successful traders have an innate gift.
Richard Dennis taught his students, who were called the Turtle Traders, the Donchian Channel Trading Strategy. The experiment was a massive success. Two sets of students earned $175 million in only five years!
And this was more than 50 years ago when $175 million was worth a lot more than it is today. Many former Turtle traders run their funds. For example, Jerry Parker founded Chesapeake Capital.
How to Use the Donchian Channel Indicator
The Donchian Channel Indicator is a versatile tool that can be used in various ways to analyze market trends and identify trading opportunities. Here are some practical applications of the indicator:
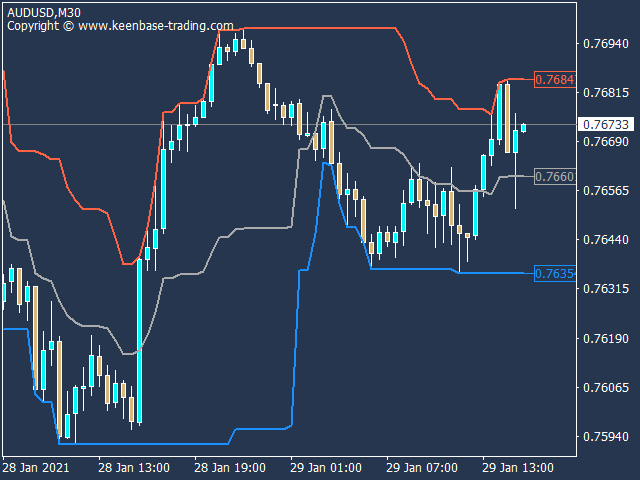
- Identifying Trends: The Donchian Channel Indicator can help you identify trends by analyzing the direction of the channel. An upward-sloping channel indicates an uptrend, while a downward-sloping channel suggests a downtrend. This visual representation makes it easier to spot the overall market direction.
- Buy and Sell Signals: The indicator can generate buy and sell signals based on price breaks out of the channel. A buy signal occurs when the price breaks above the upper band, indicating a potential upward movement. Conversely, a sell signal is generated when the price breaks below the lower band, suggesting a possible downward trend.
- Support and Resistance: The Donchian Channel Indicator can also be used to identify support and resistance levels. The middle line of the channel often acts as a support or resistance level, depending on the trend direction. This can help you make more informed decisions about entry and exit points.
- Multi-Timeframe Analysis: By analyzing the Donchian Channel on different timeframes, you can gain a better understanding of the market trend and identify trading opportunities. This multi-timeframe analysis allows you to see the bigger picture and make more strategic trading decisions.
Potential Applications of the Donchian Channel
- You can use the Donchian channel to detect reversals, breakouts, newly formed trends, and stop-loss trailing.
- One can also use the Donchian channel to design mean reversion or breakout trading strategies.
- This indicator can tell you the extent of a price’s trend or whether it’s ranging based on the expansion or contraction of the bands.
- You can use false breakouts of the outer bands as exit signals for your trade. For example, look for moments when the price moves to break out of the lower or upper band.
- If the market price challenges the lower band but quickly comes back inside, closing your order may be a good time, as the market is likely to retrace.
- It’s common for traders to use a reversal towards a middle band as confirmation to enter a market in trend continuation trade signals.
- You can replicate the Turtle Trading System Rules and trade like the original Turtles, giving you a complete trading strategy covering entry, trade management, and exit. However, it works best only in trending markets.
Synergies with the Donchian Channel
Unlike many trading systems, the indicator has proven effective even when used independently. The original Turtle Trading experiment exclusively used the Donchian Channel.
Still, you can combine the Donchian Channels with other indicators such as volume or fundamental analysis to ensure a strong tailwind to trend moves.
Conclusion
The Donchian Channel Indicator is one of the few indicators that has been tried and tested with successful results. Traders can use it to build a visual map of the price of a security.
Expansion of the outer bands in either direction indicates higher volatility in the trend movement.
Where the price contracts around the middle line, it suggests lower volatility and range-bound conditions. Try out the Donchian Channels, perhaps with your version of the Turtle Trading System rules to see if it works for you!
Final Thoughts
The Donchian Channel indicator is a powerful tool that can be used to analyze market trends and identify trading opportunities. By understanding how to use the indicator and adjusting the settings to suit your trading needs, you can gain a competitive edge in the market.
Remember to always use the indicator in conjunction with other forms of analysis and risk management techniques to maximize your trading performance.
The Donchian Channel Indicator’s ability to provide clear visual cues and its adaptability to different trading strategies make it an invaluable resource for traders looking to enhance their market analysis and decision-making processes.


