Features
- A light-weighted indicator efficiently identifies the upward and downward crossovers and marks them using vertical lines.
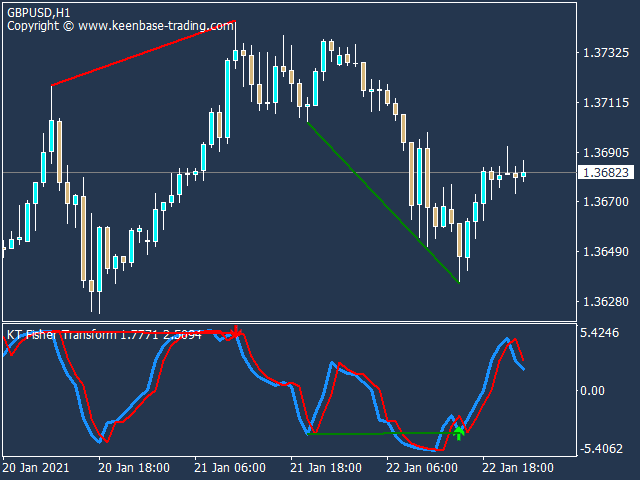
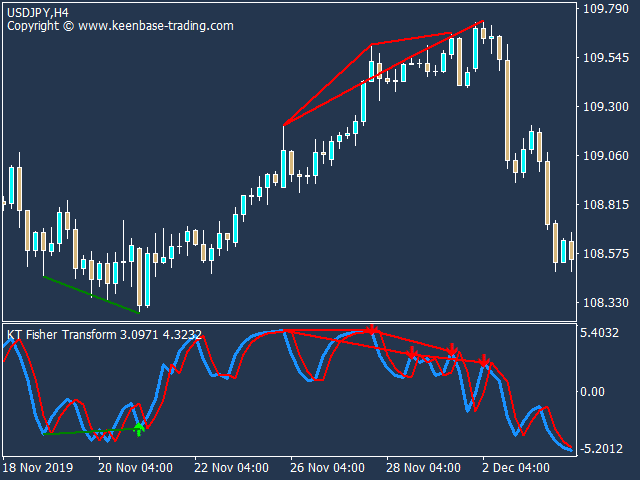
- It also finds regular and hidden divergences on the Fisher Transform oscillator.
- It works efficiently to detect sharp reversals in price.
- Traders can also use it for scalping on smaller timeframes.
- All kind of Metatrader alerts included.
Fisher Transform Formula
Fisher Transform Oscillator = ½ * ln [(1 + X) / (1 – X)]
Where,
The natural logarithm (ln) is used to transform the asset's price to a level between -1 and 1, making calculation easier.
Buy and Sell Example
Buy Signals:
- Main-line cross above the 0.0 level after touching an extreme negative area.
- Upward crossover of main and signal line either in a positive or negative area.
- Bullish regular or hidden divergence.
Sell Signals:
- Main-line cross below the 0.0 level after touching an extreme positive area.
- Downward crossover of the main and signal line either in a positive or negative area.
- Bearish regular or hidden divergence.
Pro Tip:
Fisher Transform indicator can be very noisy and provide multiple false signals before the actual price reversal occurs. Therefore, combining it with other indicators for trade confirmation is best instead of using it as a standalone indicator.
Input Parameters
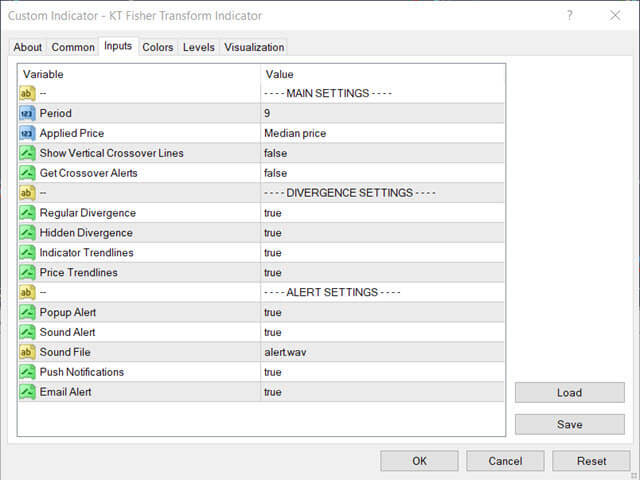
- Period: The integer value used to calculate the main and signal line.
- Show Vertical Lines: If true, the indicator will draw vertical lines on each upward or downward crossover. To avoid unnecessary clutter, we recommend keeping it off.
- Get Crossover Alerts: If true, the indicator will provide alerts on each crossover.
- Regular/Hidden Divergence: You can turn on/off the divergence detection.
- Indicator Trendlines: If true, the indicator will draw the oscillator's trendlines for each successive divergence.
- Price Trendlines: If true, the indicator will draw the trendlines on the price chart for each successive divergence.
Example of Fisher Transform Trading Strategy
We can design an effective trading strategy using the combination of 200 Moving Average with overbought and oversold and trigger line crossover in the oscillator.
- Long Trade Signal: Price is above 200 moving average and trigger line upward crossover in the oversold zone.
- Short Trade Signal: Price is below 200 moving average and trigger line downward crossover in the overbought zone.
Applications
- It provides a new approach to technical analysis using the Gaussian distribution.
- It can detect the price turning points and trend reversals very effectively.
- When combined with Fisher Transform, classic price action trading provides an impressive result.
- It can trade divergences between the instrument's price and oscillator.
- Advanced trading strategies can be designed by combining Fisher Transform and Bollinger Bands because they offer the advantage of Gaussian and standard deviation when used together.
- The Fisher Transform can also be applied to the Relative Strength Index (RSI) and MACD because the Gaussian distribution can be applied to the price of an asset and other oscillators.
Limitations
- The leading nature of the Fisher Transform oscillator tries to predict the price turning points without any lag. That's why in some instances, it can be extremely noisy.
- It's not easy to judge the overbought and oversold region as, unlike the other oscillators, the oscillator's upper and lower limit is not fixed.
- It is susceptible to providing a streak of multiple false signals.


