Using the KT Forex Line Indicator: Trading Techniques
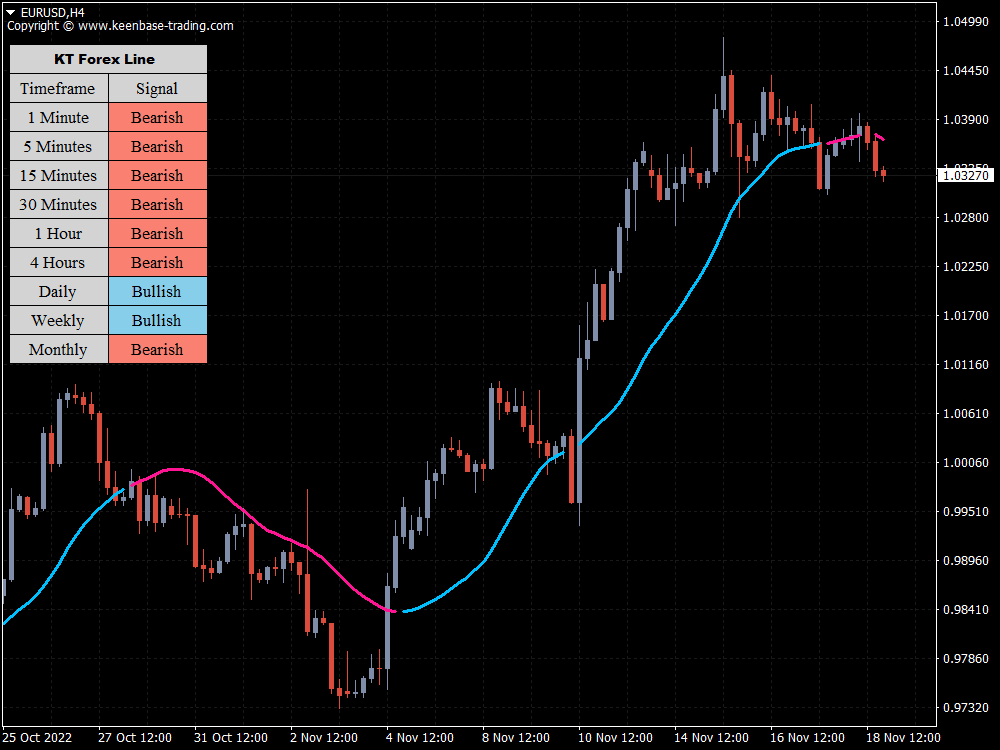
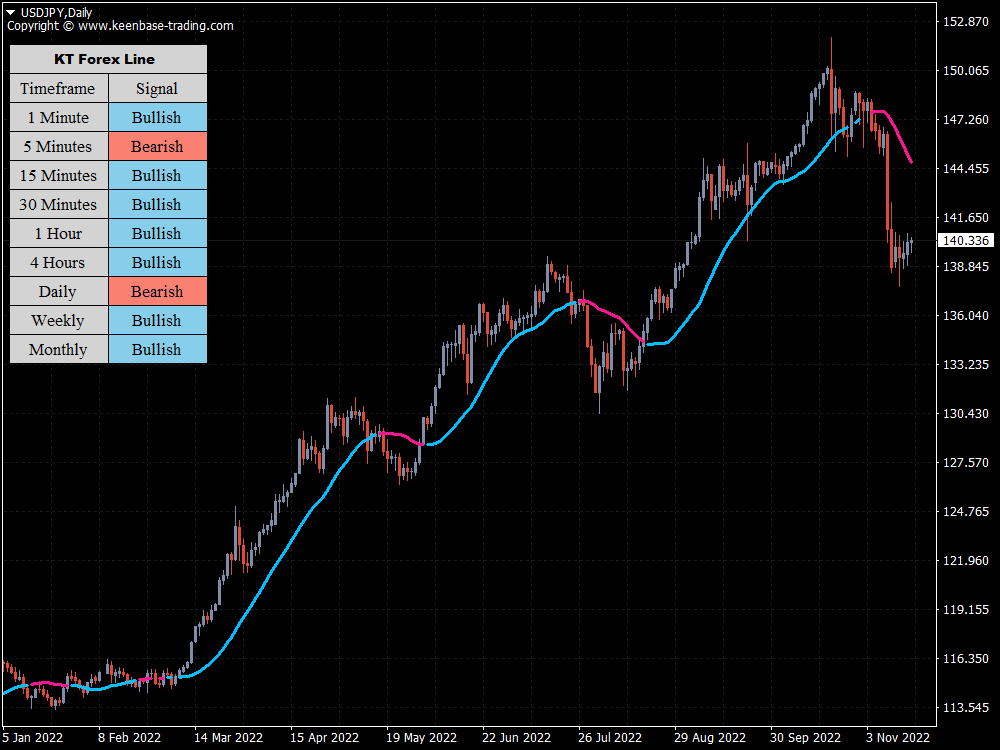
The indicator highlights the best time for entering a trade by altering the color of the indicator line. This indicator best suits higher timeframe charts, such as daily or weekly.
While it can be used on shorter timeframe charts, the indicator is susceptible to frequent color changes because of the price volatility, which could become confusing.
That said, you increase your chances of securing more gains and making significant profits by using this indicator as frequently as possible. Additionally, you want to avoid ranging markets and employ the indicator only when the market is in a visible trend.
Buy Signal
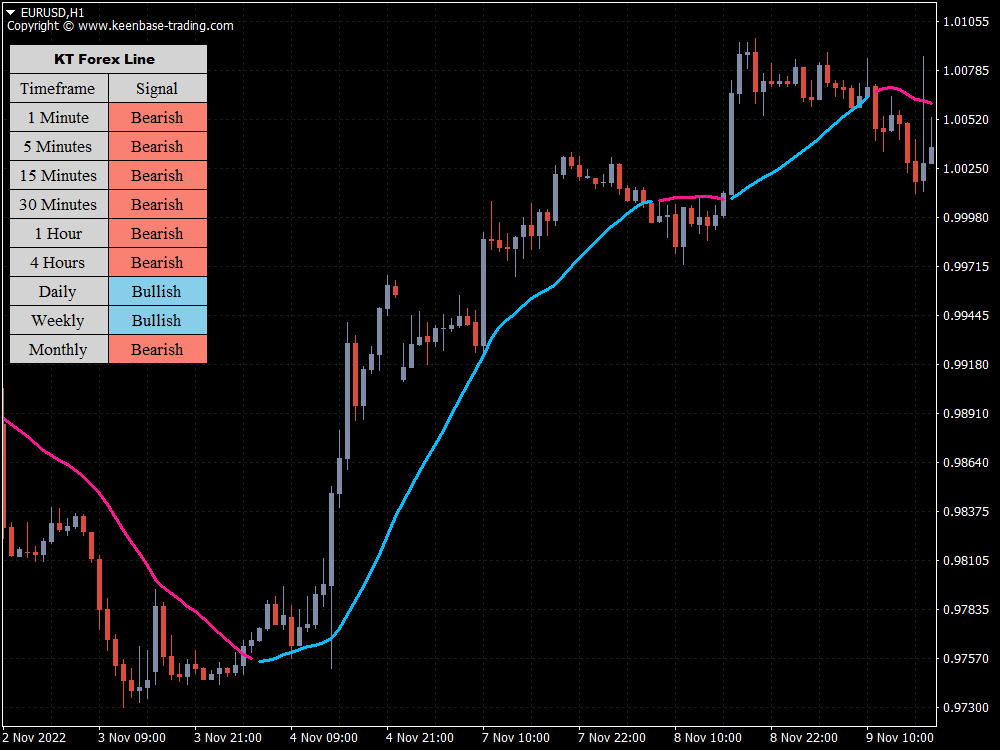
- The growth value of the currency pair in question is highlighted through the indicator line in an up-trending market.
- The indicator line should be above the signal candle's closing point.
Given an uptrend in the market, a long position can be initiated on the signal candle after the line has reached these values.
However, such a position should be closed out as soon as the line changes colors, as this signals a change in the trend and opens the door for new trades.
Sell Signal
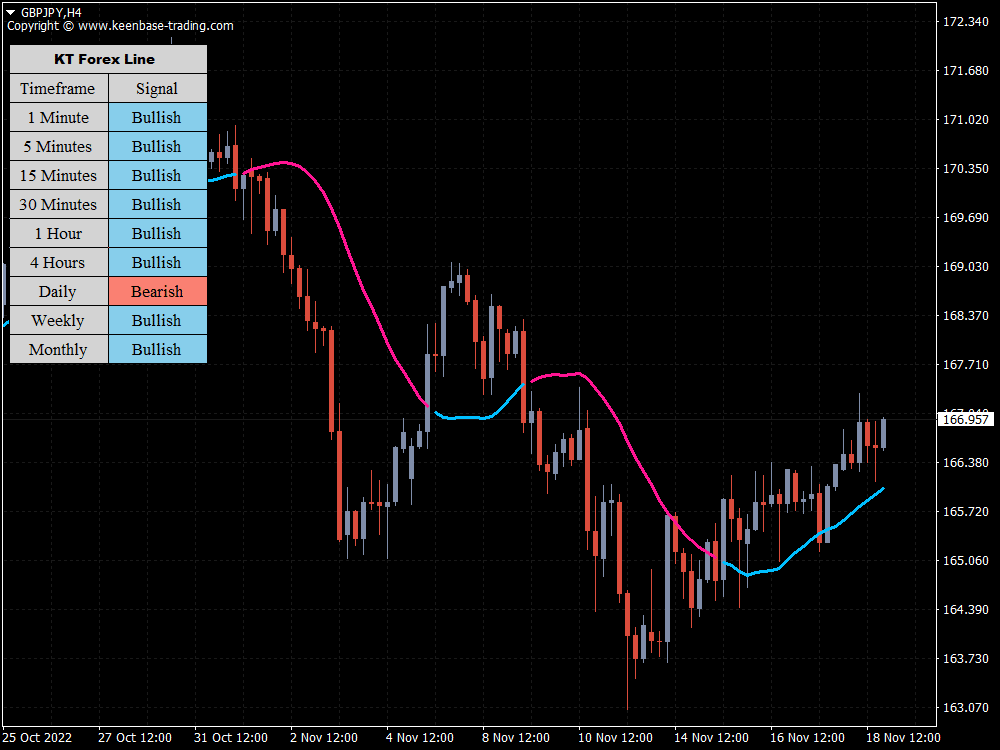
- The indicator line changes from blue to white and moves downward.
- The signal candle closes below the indicator line.
A sell trade can be initiated if these conditions appear on a particular candle. As soon as the indicator line's values, such as color or direction, change, the trade should be instantly closed.
At this point, opening new positions in the order of the present movement is possible.
Combining the Forex Line with other indicators
As the market fluctuates between trends, the Forex Line Indicator alerts you to the strength of those trends and highlights trade opportunities in that direction.
In addition, the indicator can be used with other tools, such as the Relative Strength Index (RSI), to determine momentum and Bollinger Bands to determine volatility in the market.
To improve the chances of the trade, they can serve as additional trade confirmation. The Forex Line highlights trends, but understanding volume, momentum and volatility is also helpful.
Conclusion
KT Forex Line indicator is among the simplest technical indicators to use. It is made to function best for forex trading and is popular with most traders that employ moving average trading systems.
All that is needed is an understanding of the simple dynamics behind the indicator’s line colors. For example, when the line's color switches from white to blue, it is a buy signal; when it switches back to white, it is a sell signal.
Additionally, testing the indicator and your confidence first on a demo account before moving to a real account with natural capital is advisable.


