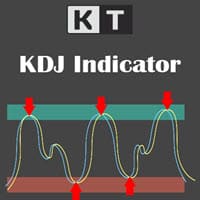
Most professional traders will be familiar with the stochastic oscillator's K and D lines. However, the extra line called J is entirely new. The line represents the divergence between K and D values.
It compares the current price to the low, high, and range of a predefined period and generates two lines, %K and %D. The faster line is %K, and the signal line is %D, which is simply a moving average of %K.
A third line, %J, is added to the KT KDJ. The %J line is merely the difference between the other two lines and is very similar to the MACD.
History
In 1950s, George Lane invented the stochastic oscillator. The term stochastic refers to the point of a current price about its price range over time.
This indicator predicts price turning points by comparing the closing price to its price range.
Source: Seputar Forex
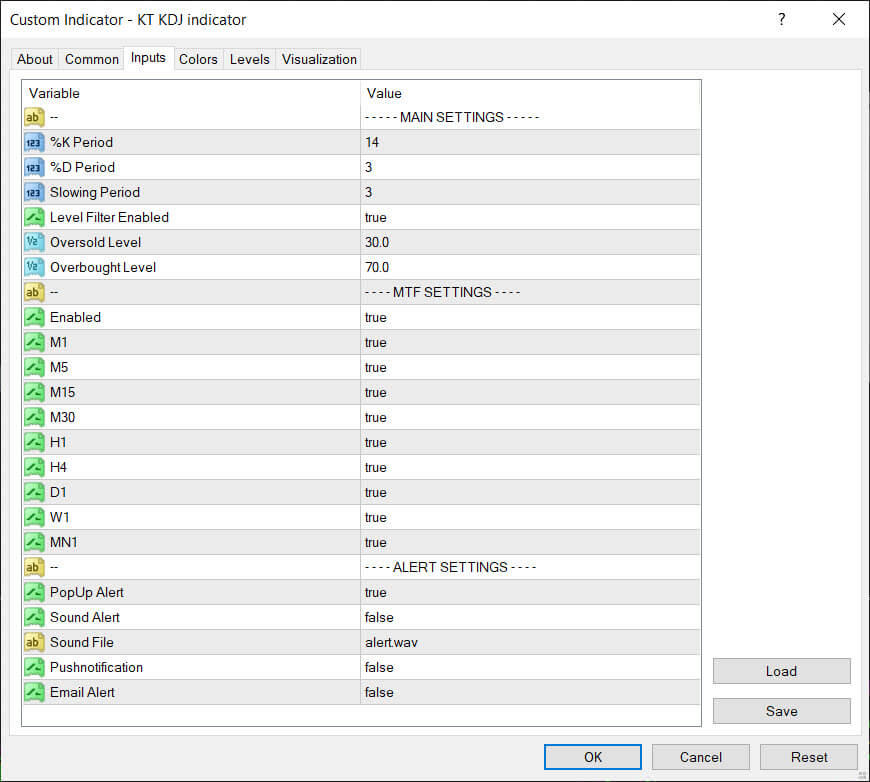
Inputs
Calculation
KDJ is calculated similarly to the stochastic indicator, except having a J line.
The stochastic oscillator is calculated as follows:
%K = C - LnHn - Ln100
%D = %K1 + %K2 + %K33
The %J line is calculated as follows:
%J = (%D 3)- (%K 2)
Where,
C =the last closing price
Ln = lowest price over the previous n periods
Hn = highest price over the previous n periods
%D = this is the 3-period simple moving average of the %K.
Features
- It analyzes and projects changes in trends and price patterns.
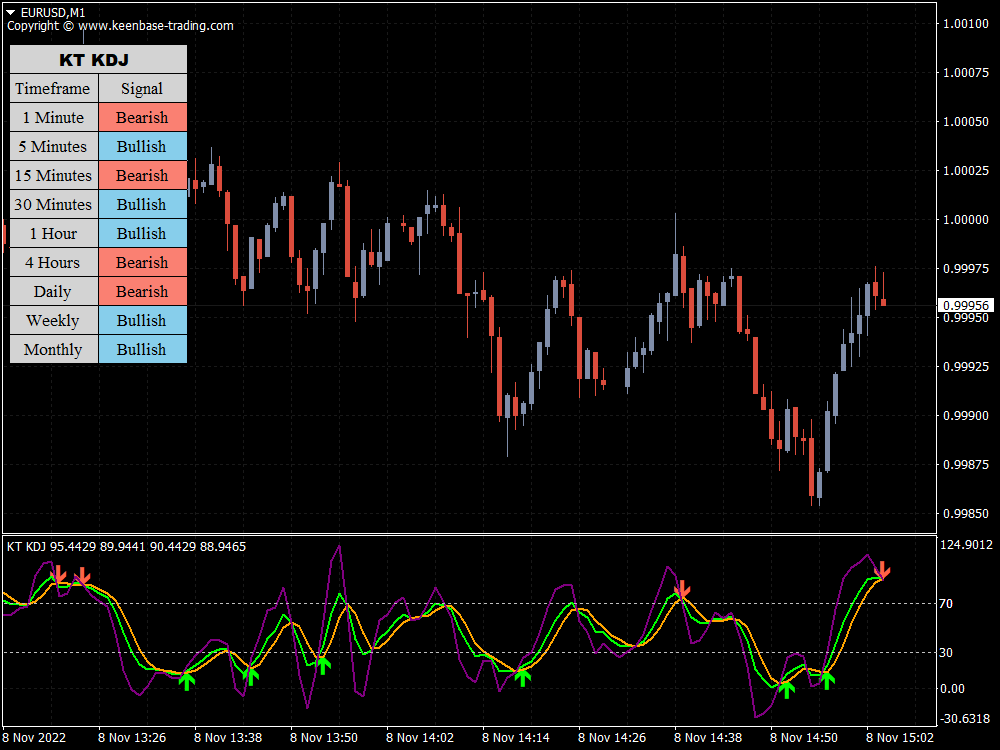
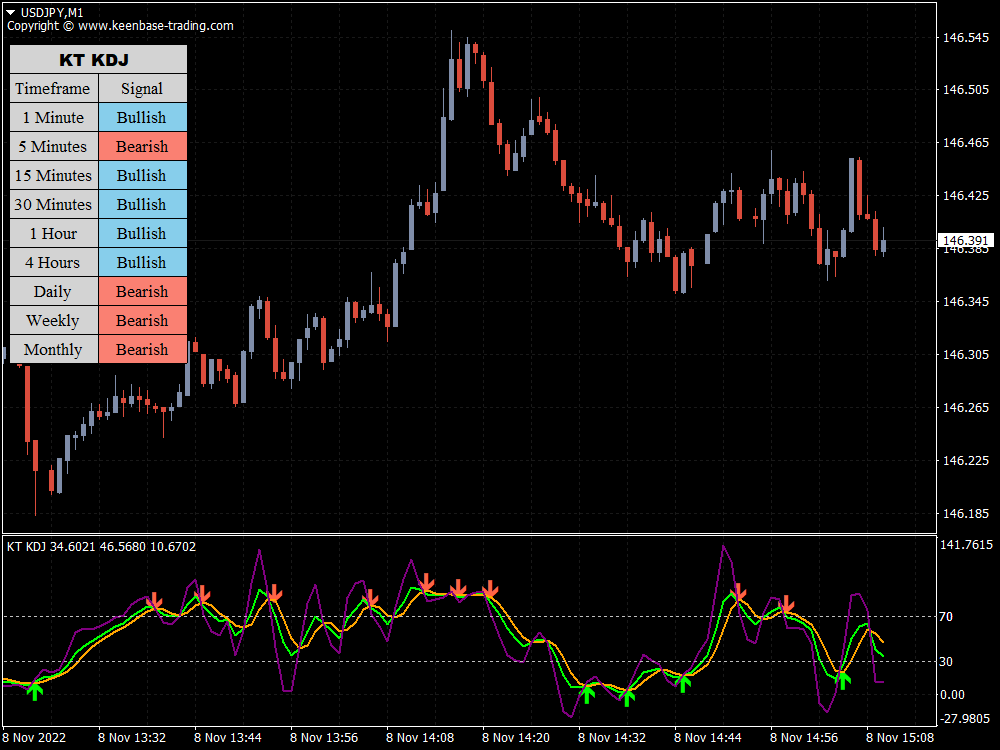
- It comes with a multi-timeframe scanner which scans for the upcoming signals in real time.
- It works across multiple instruments and time frames.
- You can adjust the K, D, and J settings to your particular needs.
Potential Application
The KT KDJ indicator functions similarly to a regular stochastic but is still a lagging indicator. Its most common signals are based on where the %J line cross is in the range concerning the oversold and overbought zones.
The market is neutral if it is between 20 and 80, bullish/overbought if it is above 80, and bearish/oversold if it is below 20. You must be careful if it is below 0 or above 100, as it is highly bearish/oversold and extremely bullish/overbought, respectively.
You will receive two signals when trading with the KT KDJ indicator. When the three lines converge above the overbought level, with the blue line above the yellow line and the yellow line above the purple line, this could be interpreted as a sell signal.
When the lines converge below the oversold level, with the blue line above the yellow line and the yellow line above the purple line, it may be a buy signal.
Suggestions for Complementary Indicators/EA
Other indicators, such as the Average Directional Index (ADX) and Average True Range (ATR), can be combined with the KT KDJ indicator for the best results.
Being ahead of the curve, the former can suggest a future trend reversal. The latter can gauge market volatility, which is particularly helpful given that the KT KDJ indicator doesn't operate well on flat markets.
Conclusion
The KT KDJ indicator is a helpful technical indicator for analyzing market trends. Using the KT KDJ indicator in a market with high volatility is advisable.
Remember that false signals might appear when analyzing price patterns formed by the KT KDJ indicator.
Also, note that no indicator will provide you with 100% accurate signals. Make sure you use proper risk management strategies.
For example, you can utilize the ATR to help decide stop loss placement. Try this indicator with a demo account to see how you can combine it with your trading.


