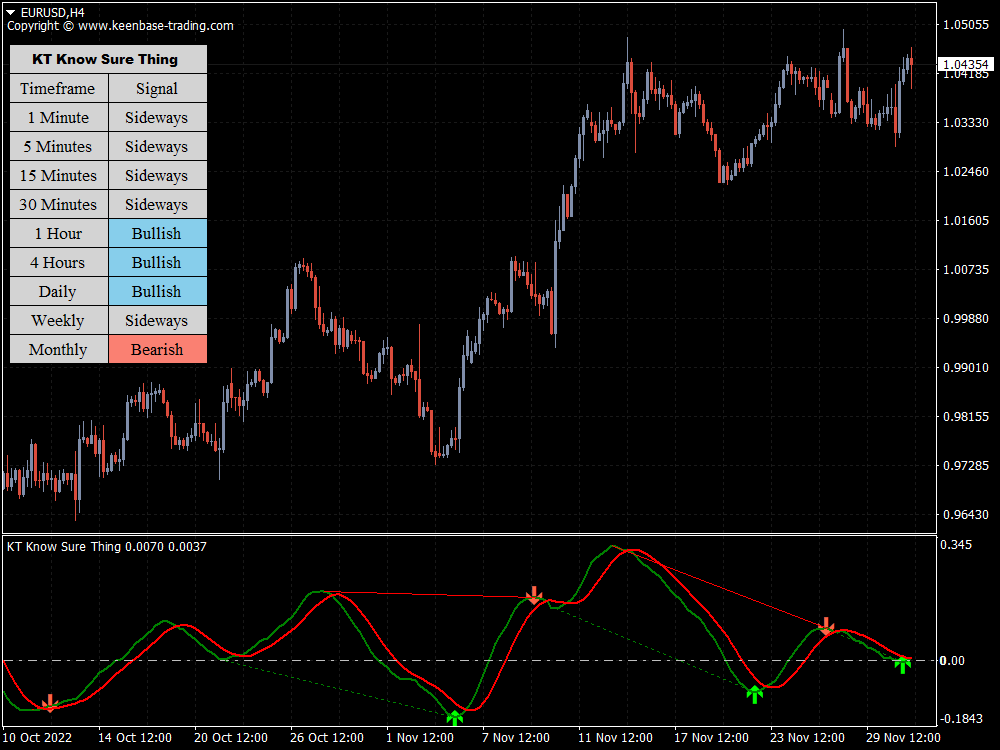
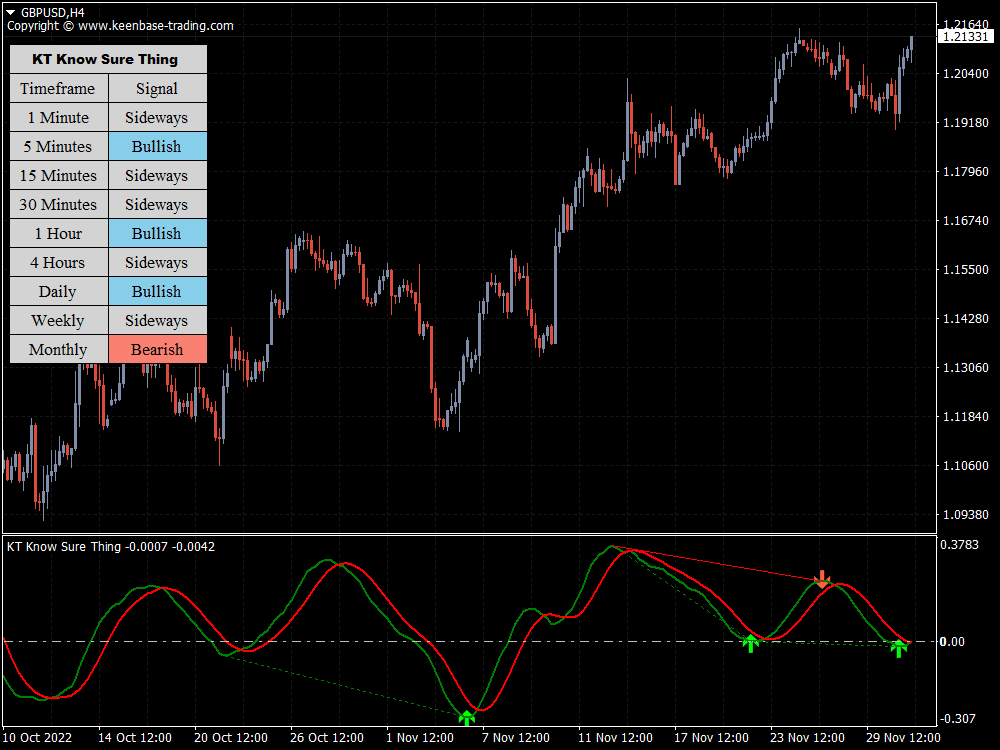
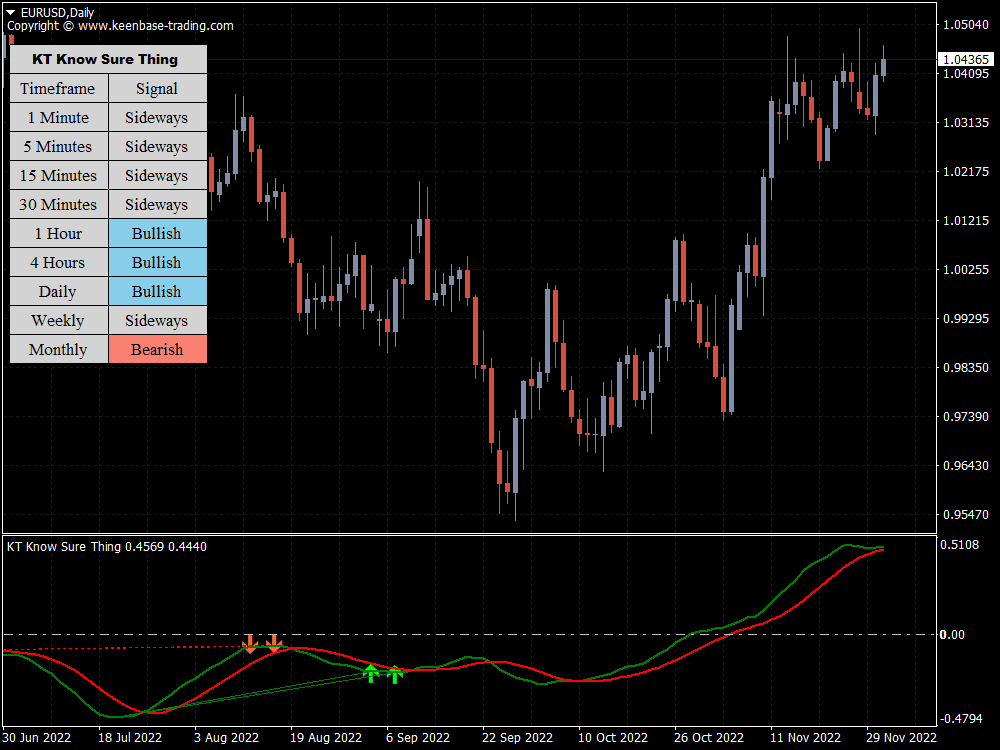
Even though they are rarely used, Pring uses trend lines frequently when working with KST. Pring continued by pointing out that applied trend lines were helpful and should not be disregarded, as such breaks reinforce signal line crossovers and their related uses.
Traders can use the KST indicator to identify and capitalize on buy and sell signals before most of the market catches on. Here’s how:
Buy Signals
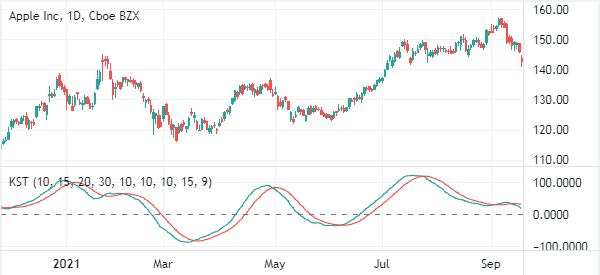
A buy signal is highlighted if the KST crosses over the "zero line." Also, a bullish trend is established if the KST crosses above the zero line and remains there for an extended period of time.
Sell Signals
Similarly, a sell signal is generated if the KST line falls below the zero line. A bearish trend is confirmed if the KST extends its price action below the zero line.
The Calculation (Formula) For the Know Sure Thing Indicator
Despite its appearance, KST is simply a weighted average of four different rate-of-change values that have been smoothed. Calculate the 10-period rate-of-change and smooth it with a 10-period simple moving average, for example.
The four different combinations are shown in the formula box below with their default settings. These combinations are then weighted and added up. The shortest timeframe carries the least weight (1), while the longest timeframe carries the most weight (4). As a signal line, a 9-period simple moving average is used.
RCMA1 = 10-Period SMA of 10-Period Rate-of-Change
RCMA2 = 10-Period SMA of 15-Period Rate-of-Change
RCMA3 = 10-Period SMA of 20-Period Rate-of-Change
RCMA4 = 15-Period SMA of 30-Period Rate-of-Change
KST = (RCMA1 x 1) + (RCMA2 x 2) + (RCMA3 x 3) + (RCMA4 x 4)
Signal Line = 9-period SMA of KST
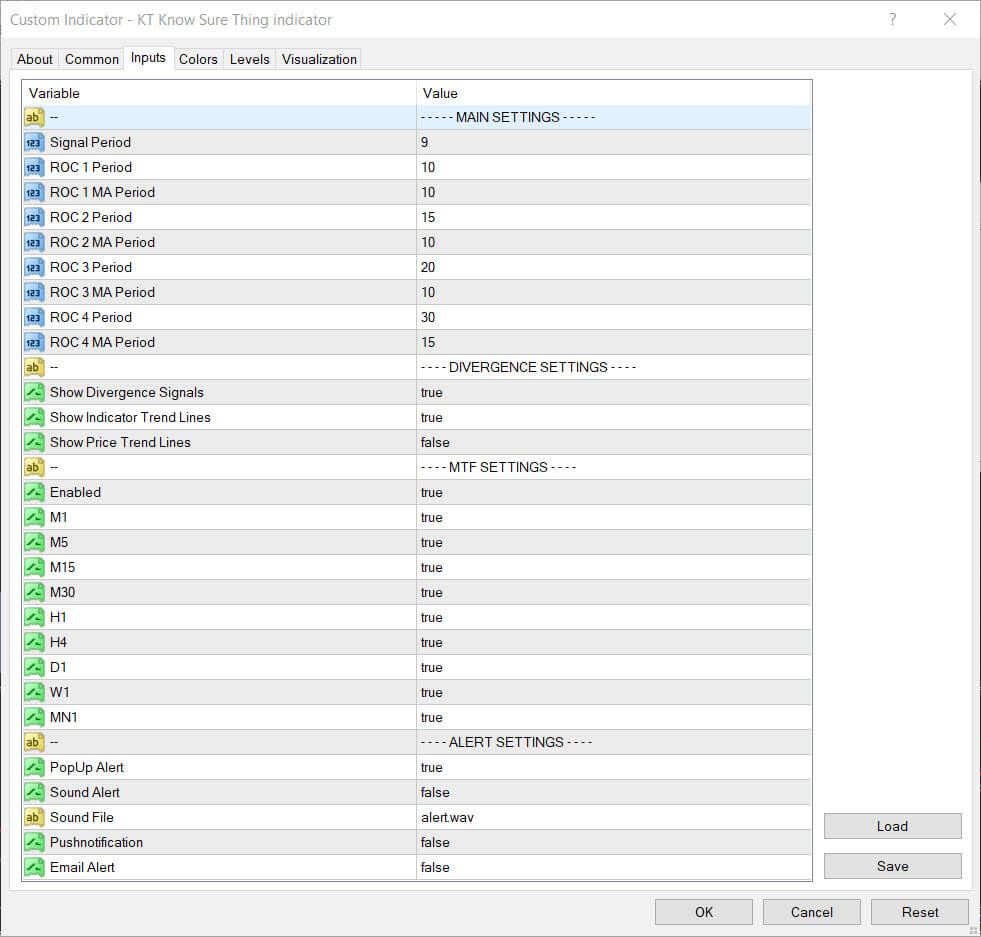
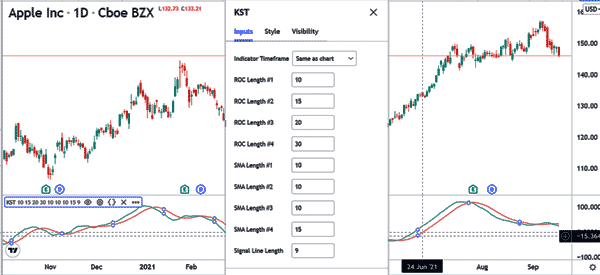
Inputs
The Default Setting for the KST Indicator
To the untrained eye, the default settings used in constructing a KST indicator may appear to be just a random combination of numbers. However, when broken down, the meaning of these numbers is clear and easy to understand, even for new traders. The following are the nine numerical default setting parameters:
KST (10, 15, 20, 30, 10, 10, 10, 15, and 9)
The first four numbers (10, 15, 20, and 30) are the rate-of-change (ROC) settings, with each number highlighting the number of rate-of-change periods (days). Each simple moving average (SMA) includes these.
The second four figures (10, 10, 10, and 15) indicate the number of periods in each of the four simple moving averages used to calculate a KST oscillator.
The final number (9) refers to the signal line's moving average period, allowing traders to identify and capitalize on crossovers.
Key Features of the KST Indicator
- The Know Sure Thing indicator is a thorough and reliable indicator that equips traders with an effective tool to predict potential breakouts.
- The KST indicator can be used in day trade, scalp trading, or long-term trading.
- The KST indicator features two lines, one smooth and the other normal, and a signal line (zero line).
- The lines in the KST indicator can be customized to suit the user's color or sensitivity preference.
- This indicator can be used across all time frames and easily integrated into numerous trading strategies.
Summary
The KST indicator is a reliable and popular market analysis tool as it provides a well-detailed overview of short- and long-term price action in the market.
Becoming fluid or mastering the KSI indicator will help a trader develop a trained eye for identifying and predicting momentum breakouts ahead of the market, which is a particular skill. In addition, this skill can allow them to develop better-tuned, more comprehensive, and accurate trading strategies and capitalize on real-time price movements.
Regardless, there is no harm in combining the KST indicator with other specialized indicators to improve their trading experience. You can explore the Keenbase Trading indicator basket to find a combination of indicators best suited for you!
Nonetheless, the Know Sure Thing indicator is a powerful oscillator-based trading indicator used in technical analysis and can be used across the financial industry.


