Formula Behind the KT Market Speed Indicator
It's a simple technical analysis tool with an equally simple formula. It uses the general physics formula for speed:
Speed (s) = Total Distance Travelled / Time (s=d/t)
Time (t) refers to the period range that can be specified to determine the lookback period.
To calculate the appropriate length for the indicator, the absolute value of the difference between the current and closing prices over a given period must be known.
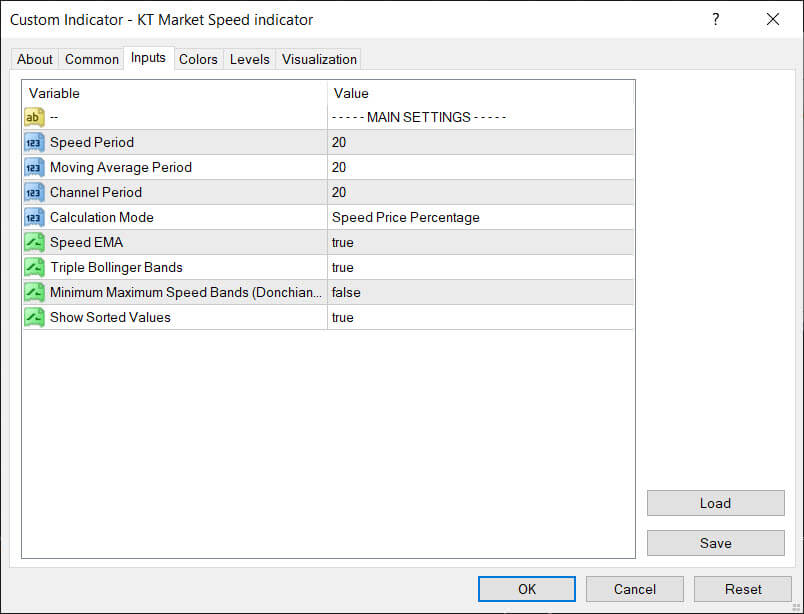
Inputs
Using the Market Speed for Trading
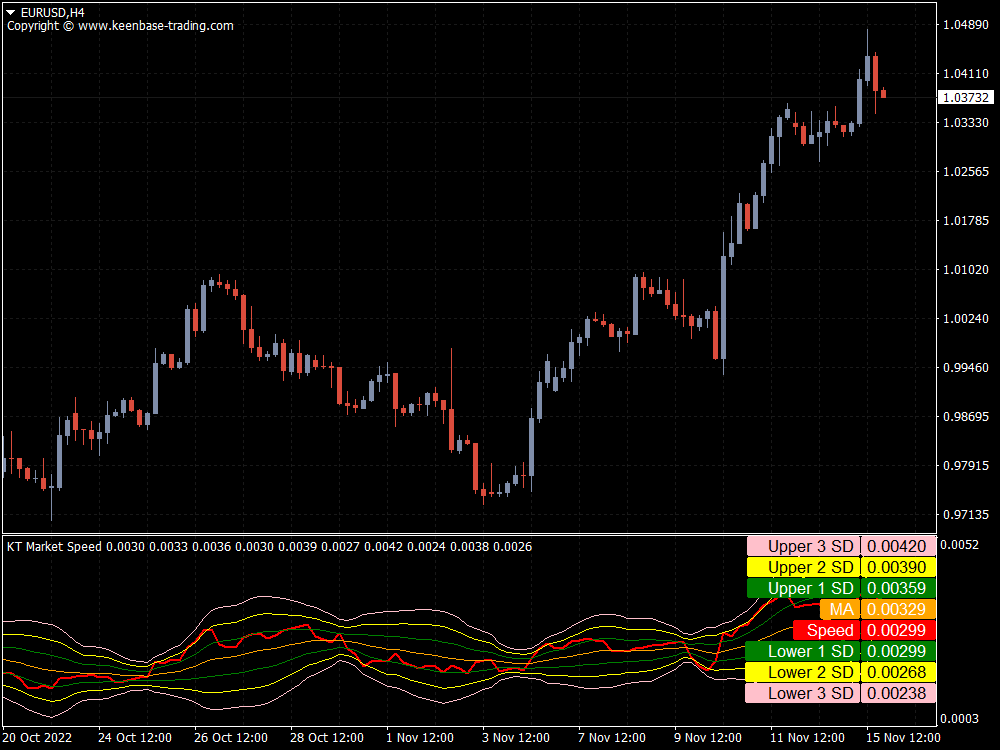
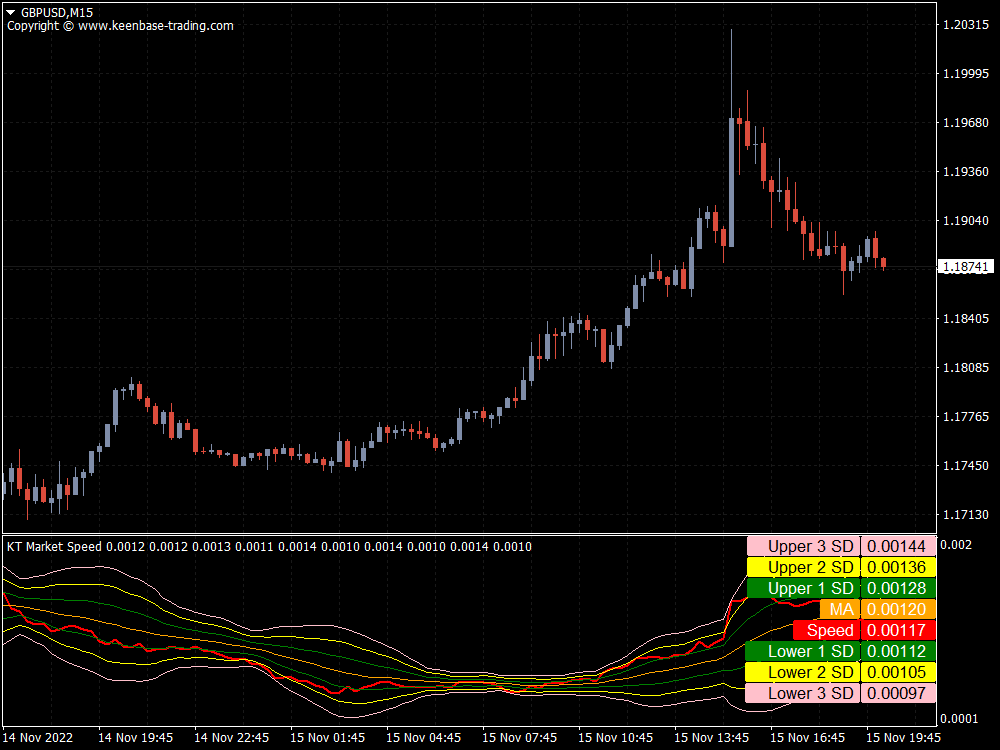
KT Market Speed Indicator has five lines to indicate different market speeds. They include maximum speed, high speed, average speed, low speed, and bottom speed.
In addition, a market speed line indicates where the market momentum (velocity) is at a particular time.
This brings the total number of lines on the indicator to six, all of which should be expressed in different colors for easier identification.
In a buy trade, the speed line dropping below the average line essentially triggers an alert exit of the trade position. However, traders can decide to hold off exiting until the line crosses the low-speed line to be sure momentum has dissipated.
On the other hand, the speed line crossing from the bottom line to the average line triggers a buy signal on the instrument being monitored.
Because the indicator deals with speed, it is more effective for use in up-trending markets than bearish ones.
Key Features
- It's a unique and precise technical analysis indicator that allows traders to spot entry accurately and exits points in the market.
- It features six lines: maximum, high, average, low, bottom, and speed.
- The Market speed works well with most trading timeframes but works exceptionally well with the daily chart.
- It works effectively with other technical analysis tools and can be integrated into most trading strategies.
- It works effectively with the Forex and other fast-moving markets, such as equities and crypto.
Summary
KT Market Speed indicator is a reliable tool for identifying slowdowns in price momentum, which is a good indication for trade entry or exit. Entering a trade when momentum is strong can be compared to jumping on a high-speed train in motion.
Timing your entry or exit on trade could be the key defining factor for a winning or losing trade. Market momentum is generally considered a reliable determinant for the entry or exit of a trade.
The general strategy dictates buying when momentum is slow, holding through increased speeds, and selling when momentum (speed) declines.
As such, having a trading tool that identifies the best-possible entry and exit points will up your trading game and allow you a better trading experience.
That said, traders can decide if they want to use this indicator in other unconventional ways as they see fit.


