What is BOS?
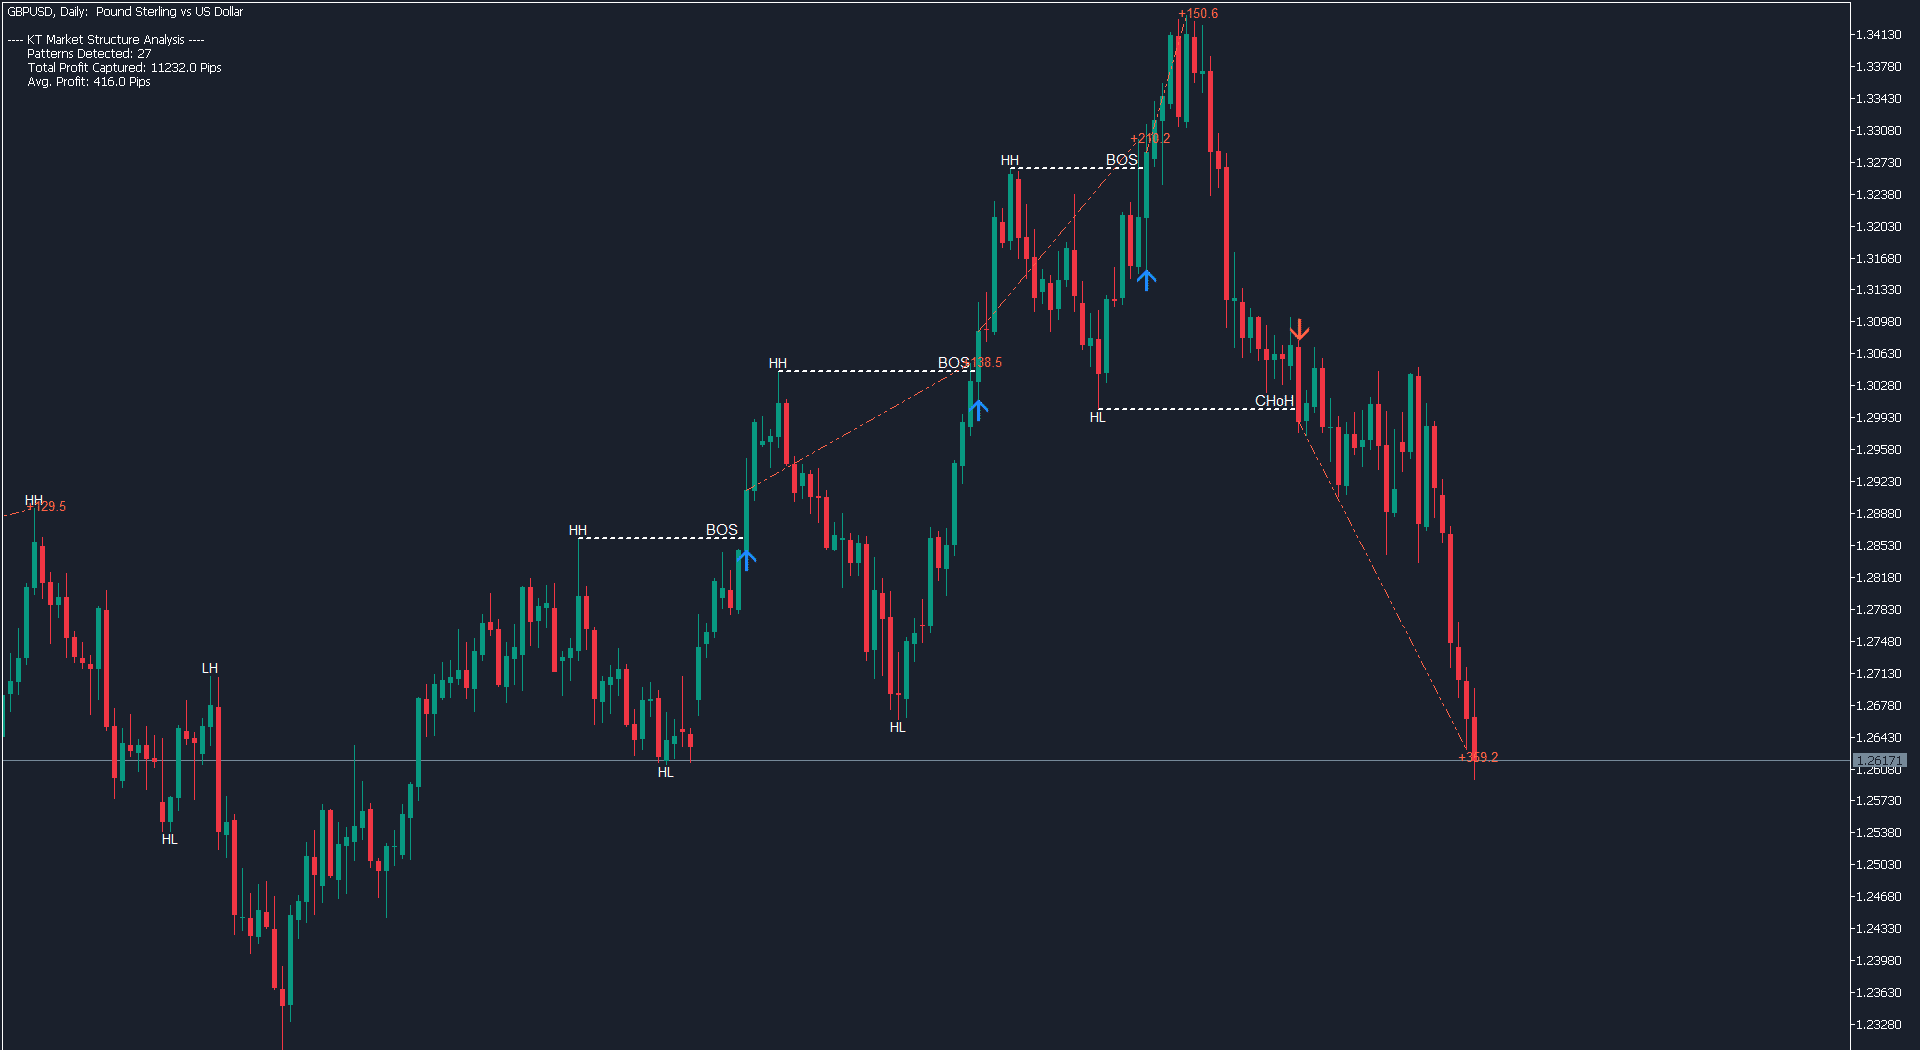
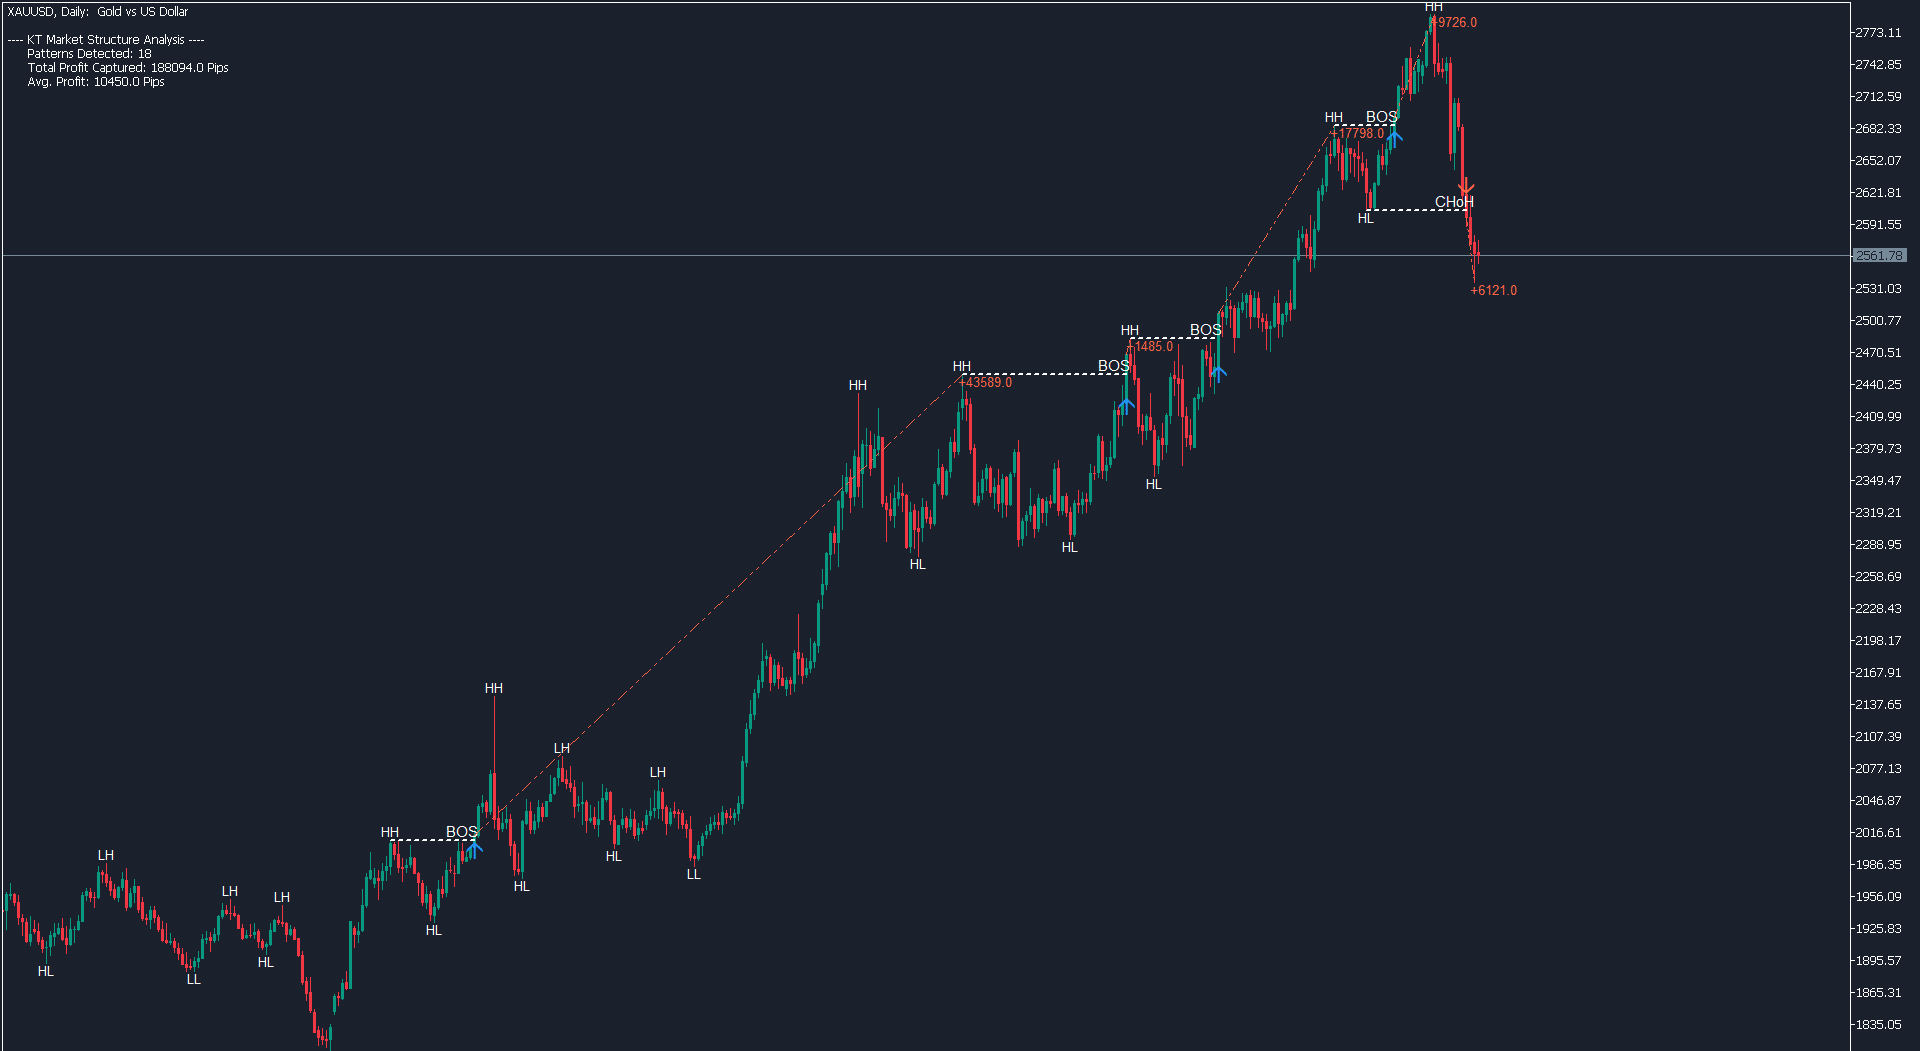
Break of Structure (BOS) is a fundamental concept in technical analysis that signifies a significant shift in market trends or momentum. It occurs when the price action breaks through a previous higher high or lower low, indicating a potential reversal or continuation of the current trend.
Identifying BOS patterns helps traders anticipate market movements and adjust their strategies to capitalize on emerging opportunities.
What is CHoCH?
Change of Character (CHoCH) is a technical analysis term used to identify potential reversals in market trends. It occurs when the price action shifts from making higher highs and higher lows to making lower highs and lower lows, or vice versa.
This change signifies a transition in market sentiment, indicating that buyers or sellers are gaining control. Detecting CHoCH helps traders anticipate trend reversals early, allowing them to adjust their trading strategies to capitalize on new market directions.
What is EQL?
Equal Highs and Lows (EQL) refer to instances in the market where the price reaches the same high or low multiple times. This repetition indicates strong support or resistance zones in technical analysis.
Identifying EQL is crucial for traders as it highlights potential reversal points or consolidation areas, allowing them to anticipate market movements and adjust their trading strategies accordingly.
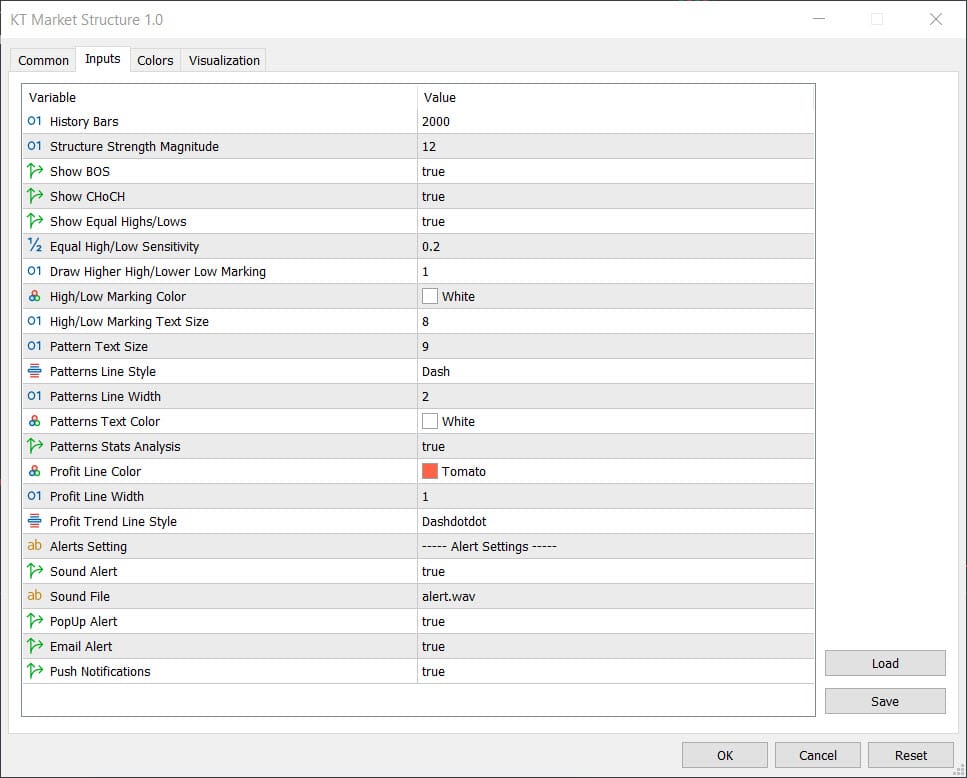
Inputs
Elevate Your Trading with the KT Market Structure Indicator
Are you looking to enhance your trading strategy with deeper market insights? This indicator offers advanced detection of key market patterns beyond just support and resistance levels.
Utilizing our proprietary algorithm, it intelligently identifies Break of Structure (BOS), Change of Character (CHoCH), Equal Highs/Lows (EQL), and swing high/low points. Additionally, it provides detailed pattern analysis by showcasing the potential profit captured by each pattern.
Further, we'll explore how market structure works, its standout features, and tips on integrating it into your trading approach. Let's get started.
If you prefer automated trading, please check our market structure ea which trades BOS and ChoCH patterns automatically without any manual intervention.
Key Takeaways
- Understanding market structure is essential for effective Forex trading and strategy development.
- Market structure provides clear visualizations of market dynamics, helping traders identify key levels, reduce losses, and improve trading accuracy.
- Combining market structure with other Forex indicators and aligning them to your unique trading style is key to achieving greater trading success.
Understanding Market Structure in Forex Trading
Grasping market structure is essential for any forex trader aiming to navigate the market effectively. Market structure focuses on understanding price movements over time.
Key elements, such as support and resistance, play a significant role: support represents a price level where buying interest can prevent further declines, while resistance is a level where selling pressure may halt price increases.
Fibonacci retracement levels are also vital in market structure analysis, as they help identify potential support and resistance areas during trend corrections.
These levels provide a framework for anticipating price movements. When the price breaks below a support level, it often signals a shift in control from buyers to sellers, suggesting the potential for further price declines.
Analyzing market structure involves recognizing patterns within price action to anticipate future movements. Traders identify swing highs and swing lows to make informed decisions. Recognizing these patterns helps traders predict market behavior more effectively and adapt their strategies accordingly.
Understanding market structure equips traders with the ability to interpret market behavior accurately. This foundation is essential for effectively using market structure patterns, which leverage price action patterns to deliver actionable insights.
How KT Market Structure indicator Works
KT Market structure streamlines the identification of key market levels by focusing on support and resistance—core concepts in technical analysis. Notably, once breached, resistance levels can often turn into support levels, underscoring the dynamic nature of the market structure.
Support and resistance are better viewed as zones rather than fixed points, given the market's tendency to retest these levels. This zonal approach offers practical guidance for pinpointing potential entry and exit points.
By analyzing market trends and historical price movements, it reveals potential price swings and present a clearer picture of market behavior.
A standout feature of this indicator is it's ability to help traders set effective stop-loss orders, reducing potential losses. Their visual clarity simplifies interpreting market signals, making them accessible to even beginner traders.
Integrating volume analysis and candlestick patterns can further validate market structure shifts, enhancing trade execution.
In practice, traders using market structure have shown improved accuracy in predicting price movements. With these tools, traders can navigate the forex market with enhanced confidence and precision, ultimately boosting their trading performance.
Advantages of Using Market Structure Patterns
Detailed market structure patterns serve as a trader's essential tool for navigating the forex market. One of its primary strengths lies in its ability to clearly visualize market breakouts, enabling traders to identify significant price movements swiftly—critical for making timely trading decisions.
With real-time insights, the indicator allows traders to respond to the latest market conditions, an invaluable feature in fast-moving markets where delays can mean missed opportunities. Customization options, such as adjusting the market structure strength, further enhance its adaptability to different trading styles.
The clear visualization of high/low levels assists traders in planning entry and exit points, aiding both breakout and pullback strategies.
This is a truly versatile indicator that offers extensive customization, allowing traders to tailor it to their specific needs, including unique proprietary features. This flexibility ensures seamless integration with other tools and strategies, making it a powerful, all-in-one asset in any trader’s toolkit.
Ideas About Market Structure Trading Strategies
Market structure patterns are essential for building effective trading strategies, helping traders identify potential reversal points and distinguish between real and false breakouts, leading to more confident decisions.
A common approach is breakout trading, where traders enter positions at BOS or CHoCH patterns. Conversely, pullback trading focuses on entering trades during temporary reversals within a trend, maximizing potential gains. Many traders backtest these strategies with historical data to ensure reliability.
Combining market structure indicator with tools like currency strength meter enhances decision-making by assessing relative currency strength, while swing highs and lows provide additional context for entry and exit points.
Although using a mix of indicators, such as leading and lagging types, can improve accuracy, overloading strategies can reduce signal clarity. A balanced approach helps traders make the most of the insights from market structure.
Become a Successful Trader Using Market Structure Concepts
Real-world examples demonstrate the practical benefits of using market structure patterns. For instance, a trader using the market structure in SMC (Smart Money Concept) for trend trading on the EUR/USD identified crucial BOS entry, aligning trades with the trend to achieve substantial profits.
Similarly, a swing trader analyzing the GBP/JPY pair identified a head-and-shoulders pattern with CHoCH, signaling a potential reversal. This led to a profitable short position. These examples underscore the indicator’s effectiveness in spotting key reversal points.
In another case, a trader identified a bullish reversal pattern, resulting in significant profits. Such case studies illustrate how market structure patterns can enhance decision-making and improve trading outcomes.
Integrating Market Structure with Other Tools
Incorporating order blocks with market structure provides insights into supply and demand zones, supporting trade decisions. Multi-time frame analysis allows traders to validate market structures by examining price action across different intervals.
Successful trades often result from combining market structure with price action analysis to confirm trends. Integrating these tools creates a robust trading strategy that leverages the unique strengths of each, enhancing overall effectiveness.
Summary
In summary, market structure is a powerful tool that offers traders invaluable insights into market dynamics. By mastering the basics of market structure, understanding how this indicator functions, and utilizing their key features, traders can greatly enhance their strategies.
Real-world case studies demonstrate the effectiveness of these indicators in spotting profitable trading opportunities.
