What is a Momentum Indicator
Momentum is the rate of acceleration of an asset's price or volume.
In other words, it measures the speed at which the price of an asset is moving in a particular direction over a specific period of time.
Positive momentum indicates rising prices, while negative momentum signifies falling prices.
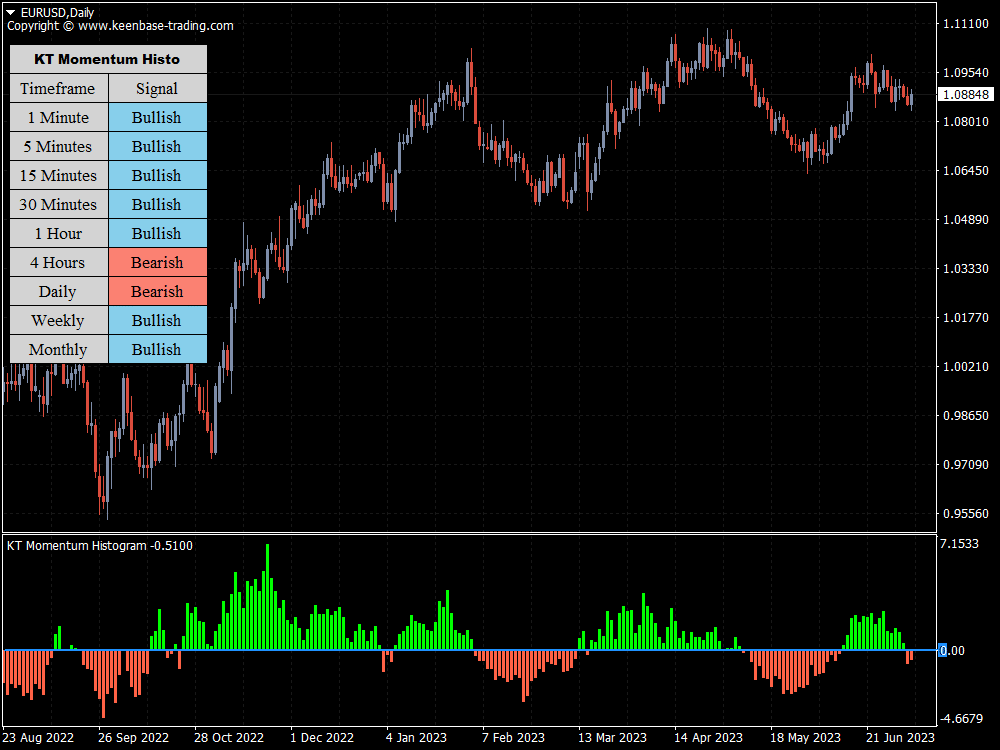
The momentum histogram is a series of vertical bars (histogram) oscillating around a zero line.
When the bars are above the zero line, it's generally seen as bullish momentum, and when they are below, you can consider that as a bearish momentum alert. The higher or lower the bars, the stronger the momentum.
Inputs
Features
Trend Identification
The Momentum Histogram is a fantastic tool for identifying the prevailing trend of an asset.
When the histogram bars cross above the zero line, it may indicate initiating a bullish trend.
When the bars cross below, it could suggest a bearish trend.
Thus, it can help traders decide about entering or exiting trades based on the direction of the market trend.
Momentum Magnitude
The size or height of the bars in the histogram indicates the magnitude of the momentum.
Larger bars indicate stronger momentum, and smaller bars imply weaker momentum.
This can assist traders in determining the force behind a trend and potentially predict how long it might last.
Overbought and Oversold Conditions
KT Momentum Histogram Indicator can identify potential overbought and oversold conditions.
When the histogram bars reach extreme positive values, it may indicate an overbought condition, implying a potential price drop.
Conversely, when bars reach extreme negative values, it might suggest an oversold condition, implying a potential price increase.
Divergence Detection
The Divergence between the price trend and the momentum histogram can signal a potential trend reversal.
If the price is making higher highs, but the histogram is making lower highs, it's a bearish divergence.
Conversely, if the price is making lower lows, but the histogram is making higher lows, it's a bullish divergence.
Divergence can be a powerful signal for traders when used correctly.
Also, This indicator can be used across different timeframes and asset classes.
Whether you're a day trader using 5-minute charts, a swing trader using daily charts, or a long-term investor using weekly charts, the Momentum Histogram can be a valuable addition to your trading toolkit.
Pro-Tips to Use KT Momentum Histogram indicator
When using this indicator, here are some pro tips to help you take full advantage of its features:
Understand Market Context
Ensure you understand the broader market context before making a trading decision based on the Momentum Histogram.
For instance, strong bearish momentum confirmation during a broader uptrend could merely be a retracement rather than a complete trend reversal.
Look for Divergences
Divergences between the Momentum Histogram and price can strongly signal potential reversals.
Remember, a bullish divergence happens when the price makes lower lows, but the histogram makes higher lows.
Bearish divergence happens when the price makes higher highs, but the histogram makes lower highs.
Overbought/Oversold are not Always Reversal Signals
While extreme readings might indicate overbought or oversold conditions, they are not necessarily immediate signals for a reversal.
Sometimes, strong bullish or bearish momentum can continue for an extended period.
Thus, consider overbought/oversold signals as potential signs of a future reversal, but look for other signs before making a decision.
Use Appropriate Risk Management
No indicator, including the Momentum Histogram, is foolproof.
Always use appropriate risk management techniques like setting stop losses and take profit levels, and never risk more than a small percentage of your trading capital on a single trade.
Always use the Momentum Histogram in conjunction with other technical analysis tools.
For example, use trend line analysis, support and resistance levels, or other indicators like Exponential Moving Averages, Average Directional Index, Average True Range, or Relative Strength Index for additional confirmation.
Indicators To Pair With the KT Momentum Histogram Indicator
Moving Average Convergence Divergence | MACD Momentum
The MACD Momentum is a trend-following momentum indicator that shows the relationship between two moving averages of a security’s price.
When used in conjunction with the Momentum Histogram Indicator, it can provide additional confirmation of momentum shifts and trend strength. The MACD histogram bars can also identify bullish or bearish divergences.
Commodity Channel Index
The Commodity Channel Index is an oscillator used to identify cyclical trends in security. It can help traders determine overbought or oversold conditions.
When CCI and the Momentum Histogram identify an asset as overbought or oversold, it can increase the reliability of a potential reversal signal.
Relative Vigor Index
The Relative Vigor Index is an oscillator that measures the consistency of price movements. It's typically used to identify potential price reversals by looking for divergences in the price.
Combining the RVI with this indicator can offer a more comprehensive picture of market momentum and potential reversal points.
Money Flow Index
The Money Flow Index is a volume-weighted relative strength index that tracks money flow.
It can identify overbought and oversold conditions and potential divergences with the price.
Using MFI with this indicator can provide a more holistic view of market conditions, incorporating price and volume data.
In essence, these indicators, when used with the Momentum Histogram Indicator, can provide a more detailed understanding of market conditions, momentum, and potential reversal points, making them valuable tools in a trader's arsenal.
Before incorporating the indicator into your trading strategy, backtest it on historical data.
