MACD, which stands for moving average convergence/divergence, is a technical trading indicator created by Gerald Appel in the late 1970s. It is intended to reveal changes in a trend's strength, direction, momentum, and duration.
Source: Latium Freelancing
Components of the MACD Indicator
The MACD is made up of two fundamental types of moving averages:
- Simple moving average (SMA):
- Exponential moving average (EMA)
MACD has a signal line which is the simple moving average (SMA. It shows average prices close to those of the period under review.
For example, if you have a 10-day MA, it calculates the sum of 10 close prices and divides it by 10. Each time a new closing price is formed, the oldest one is no longer counted
The exponential moving average (EMA) shows traders the difference between fast and slow closing prices, showing price movements and signals faster. The EMA weighs recent price action more than the SMA.
Calculation of the MACD Indicator
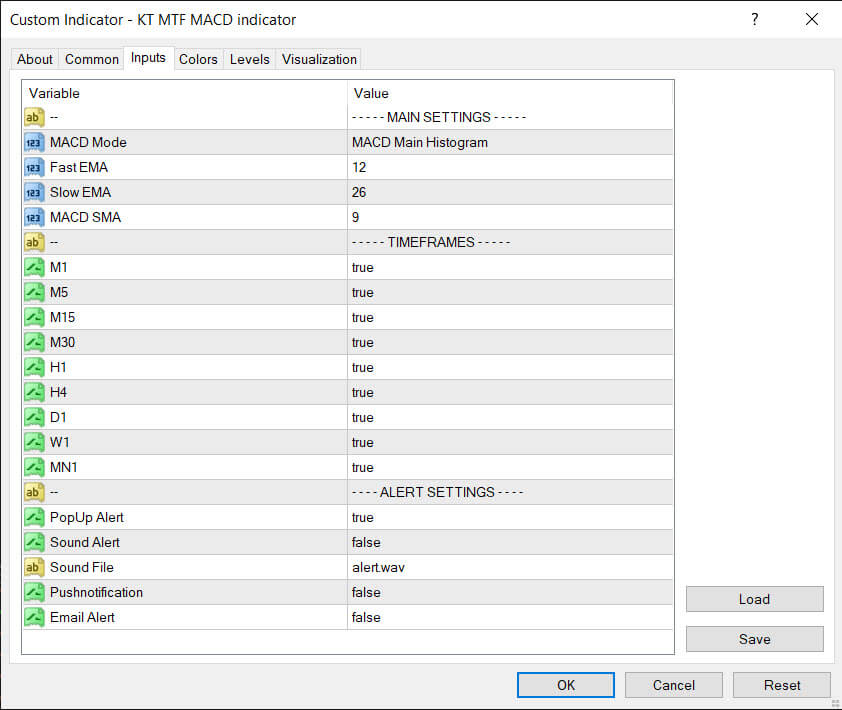
The MACD line for each time frame is calculated using two exponential moving averages of close prices with periods of 12 and 26. These MACD settings are customizable.
MACDline = KT EMA12-KT EMA26
The signal line for each time frame is then constructed as the MACD line's exponential moving average over 9 periods, which is again customizable.
Signal line = EMA9(MACD line).
Inputs
How MTF MACD Indicator Works
The principle of operation behind the KT MTF MACD is that it subtracts the longer-term moving average from the shorter-term moving average.
This way, it transforms the trend indicator into a momentum measure to depict trend direction and strength information.
Trading the MACD has no bounds, but it has a zero mean, around which it tends to oscillate as the moving averages converge, intersect and diverge.
When the moving averages move toward each other, convergence occurs. Divergence takes place when the moving averages move away from each other.
The MACD histogram is below 0 when the shorter MA is below, the longer MA and above 0 when the 12-period MA is above the 26-period MA.
As a result, positive values of the histogram point to a bullish trend, while negative values mean a downtrend.
Features
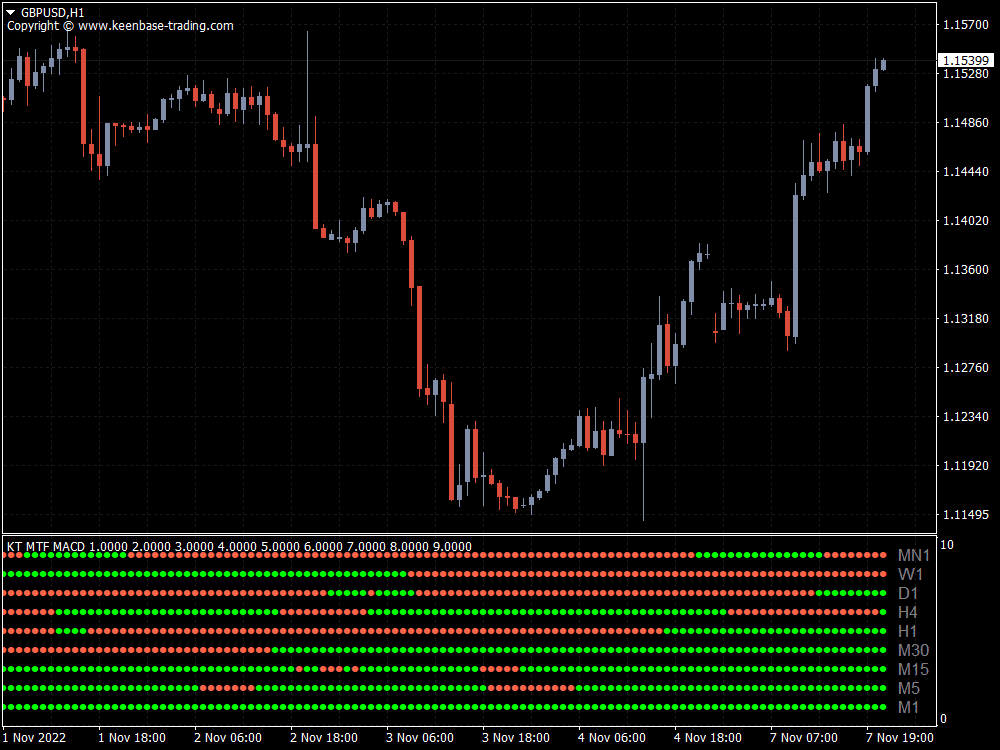
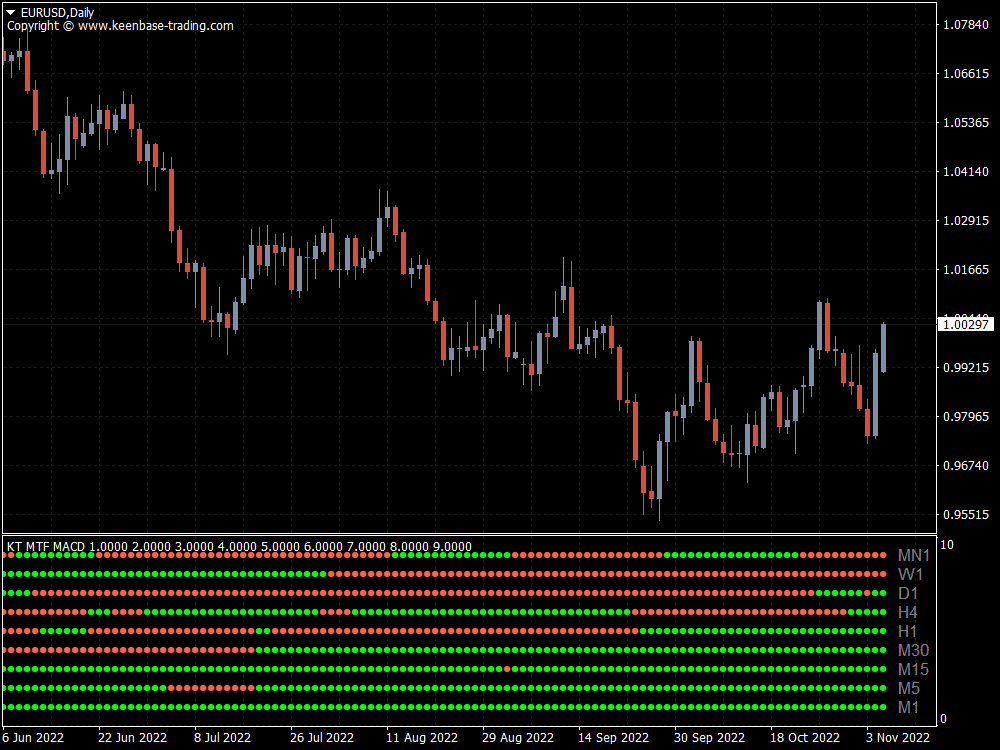
- The KT MTF MACD can simultaneously monitor up to 5 different timeframes, intervals, and instruments.
- It can recognize MACD trend conditions and signals for each data stream.
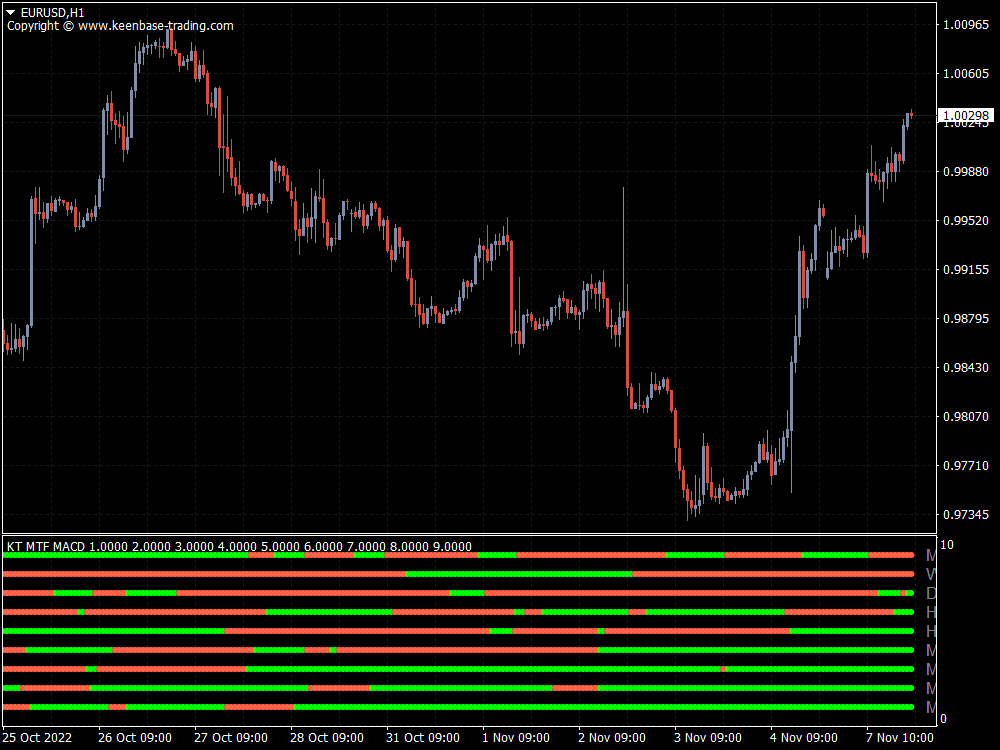
- It reduces the clutter of multi-timeframe charts to a single summary view on one chart.
- It conserves PC resources by employing fewer charts and indicators
- It has advanced Color-Coding Features and Options
- The indicator also includes a feature to alert you if the trend changes.
Potential Application
The KT MACD indicator filters trades and improves your entry and exit signal. By looking at the indicator with a higher time frame bias to determine the overall trend and the lower time frame trigger to determine the best entry point, your odds of a successful trade improve.
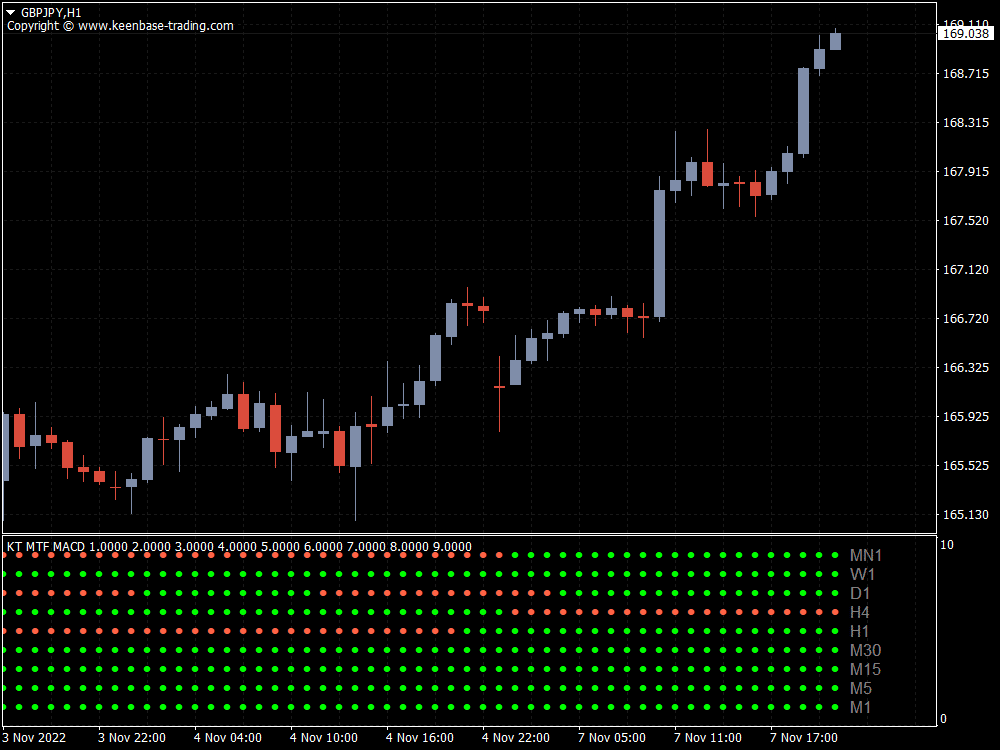
Let's assume you want to enter a buy trade. To begin, you wait for the daily time frame row to turn green. Next, you should then wait for the price to retrace.
This entails patiently waiting for the other time frames to turn red. Finally, you can open a long position once the indicator turns green again, indicating that the initial uptrend has resumed.
Let us say the Daily, 4-hour, and 1-hour charts are bearish. As a result, you should consider opening a short position as the trend is in your favor across multiple time frames.
Take care not to enter a trade that is heading for a pullback. You could be correct about the overall trend, but poor entry points may result in losing trades. So have patience and wait for alignment across all time frames.
When the KT MACD indicator switches colors, this indicates a reversal. This can be a crucial signal for counter-trend trades.
Suggestions for Complementary Indicators/EA
The MACD is a handy technical indicator. It produces different signals and can represent a solid foundation of a trading system.
Moreover, you can filter out false signals using the MACD with RSI and other technical analysis tools. For example, we recommend the KT Candlesticks Patterns to support price trends with candlestick confirmations.
Conclusion
Multi-time frame trading is an excellent way to improve your trading results because it allows you to select the best entry point inside a longer-term trend.
With the KT MTF MACD indicator, you are not required to monitor market behavior over multiple time frames. Instead, it allows you to examine various time frames at once.
To see how you can incorporate this indicator into your different trading strategies, you can try it out with a demo account first.


