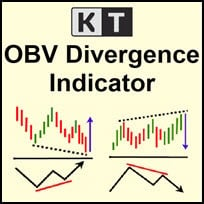
Features
- Unsymmetrical divergences are discarded for better accuracy and lesser clutter.
- Support trading strategies for trend reversal and trend continuation.
- Fully compatible and ready to embed in an Expert Advisor.
- It can be used for entries as well as for exits.
- The OBV shows the buying and selling pressure in the market.
- The price action setups near the volume divergences can be effective.
- All Metatrader alerts are available.
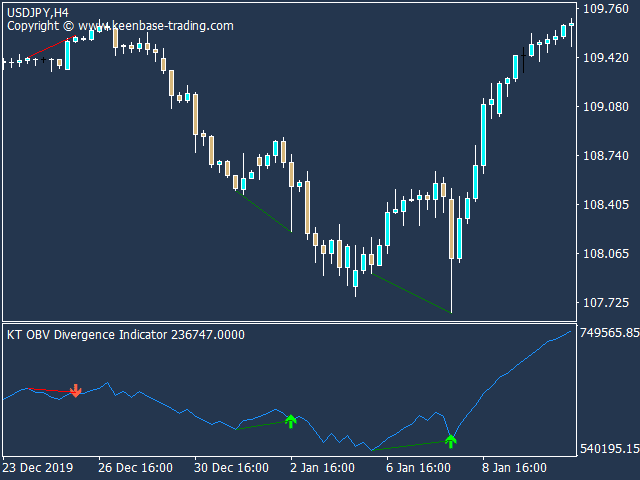
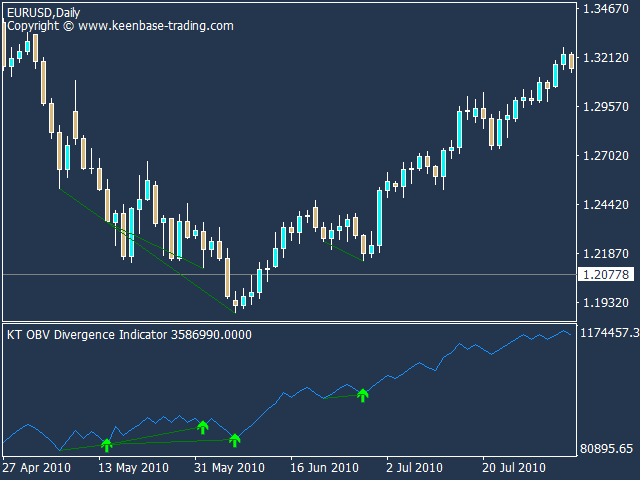
The indicator captures three divergence setups in the above chart. The price moves higher in the first setup, while the OBV makes a new lower high. This shows a sell signal.
The second configuration depicts a different scenario. When the indicator plots a lower high, the price makes a lower low, showing a bullish trend.
Finally, the price makes a lower low in the third setup, while the OBV and price make a lower high. This indicates that the price is preparing to move up in a bullish trend.
History of OBV
According to Charles Dow's basic theory of volume, the volume should rise in the trend direction, which means that the volume should increase with the rising price during an uptrend.
During a downtrend, the volume should increase when the price falls. As more research was conducted on the subject, Joseph Granville presented the theory of On Balance Volume (OBV) to the technical community in 1963 in his book, "Granville's New Key to Stock Market Profits."
Calculation of OBV Divergence indicator
The On Balance Volume (OBV) is a total of positive and negative volumes. It has a positive value when today’s price is higher than the previous closing price. It has a negative value if today's price is lower than the closing price.
The calculations are done as follows:
If the asset's closing price is higher than the previous day's closing price:
OBV = Previous OBV + Today's volume
If the asset's closing price is the same as the previous closing price:
OBV = Previous OBV + 0
If the asset's closing price is lower than the previous closing price:
OBV = Previous OBV - Volume for Today
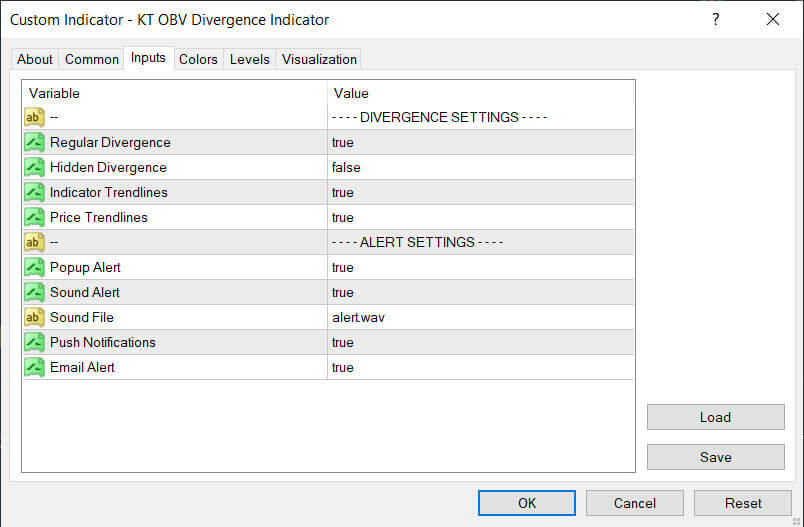
Inputs
Potential Applications
During an uptrend, the OBV oscillator will follow the price direction and continue to make higher highs and higher lows.
As a result, the price chart and OBV chart will appear nearly identical. In other words, volume supports the price increase.
During a downtrend, the indicator will make lower highs and lower lows in the same manner as the price, confirming that volume supports the downtrend.
When the price and the OBV line fail to respond to each other, the price makes a new higher high, but the OBV does not.
In an uptrend, this is the first sign of trouble. It demonstrates that volume is failing to keep up while the price rises and reaches new highs. It indicates that an increase in volume has not accompanied the price increase.
This trend is referred to as a non-confirmation uptrend and is usually seen at the end of an uptrend.
During a downtrend, we may notice that volume and price are not moving in lockstep, i.e., the price has broken the previous bottom, but volume has not.
It demonstrates that the price has broken with the lower volume. The downtrend is in trouble now because the volume no longer supports the price decline and trading range.
This is known as a non-confirmation downtrend. This type of trend occurs at the end of a bear market.
As long as price and volume continue to rise together, things are in-sync. Still, there will come a time when the price cannot reach the previous high, but the OBV line has surpassed the previous high.
This is referred to as an advanced breakout. It demonstrates that, while the price has increased marginally, volume generation is so high that OBV has made an advanced breakout.
This signals that the price will also cross the previous high. That is, volume precedes the price. Non-confirmation uptrend and downtrend are signs of weakness, whereas advanced breakout is a sign of strength.
Price and volume on down days are expected to move in the same direction, with lower highs and lower lows.
However, sometimes the price fails to break the previous low while the OBV is rising. This shows a lack of strength in the price.
Suggestions for Complementary Indicators/EA
When complemented with other indicators, The KT OBV Divergence indicator performs admirably.
For example, you can compare it with volume and price-based indicators like accumulation distribution indicators or KT Moving averages. One standard method is to combine it with a moving average and look for crossovers.
Conclusion
The On-Balance-Volume (OBV) is a powerful volume-based indicator to enhance the technical analysis. When used correctly, it can assist you in determining where to buy or sell.
Try it with a demo trading account to see how it can fit into your trading strategy!


