What are Pivot Points?
In Forex market, the pivot point is the main central price level which can show the market trend and direction along with the projected support/resistance levels.
The pivot point is found using the average of high, low, and closing price compared to the previous trading day or session. There are various calculation modes used in analyzing pivot points, each employing different formulas and methods to determine levels using data such as HIGH, LOW, and CLOSE.
We can use the calculated Pivot point and data to project the support and resistance levels in the future, which can be used to anticipate the price movement around these pivot points support and resistance.
Also, it is generally believed that if the price is trading above the pivot point, it indicates a bullish sentiment, while trading below the pivot point indicates a bearish sentiment.
Pivot Points Calculation Method
The pivot point calculation uses the data points such as the previous day’s high, low, and close price. We can calculate the pivot points using only the current period or using the daily, weekly or monthly data to estimate the pivot levels on other time frames.
Different calculation modes, such as Classical, Camarilla, Woodie, and Fibonacci, offer unique methods for determining these levels, each with its own application and benefits.
Formula of Classic Pivot Point
- P = (H + L + C) / 3
- R1 = P + (P − L) = 2×P − L
- S1 = P − (H − P) = 2×P − H
- R2 = P + (H − L)
- S2 = P − (H − L)
- R3 = H + 2×(P − L) = R1 + (H − L)
- S3 = L − 2×(H − P) = S1 − (H − L)
Where,
P = Central Pivot Range, H = High, L = Low, C = Close
R = Resistance
S = Support
Source:
Pivot point (technical analysis) Wikipedia
Types of Pivot Points
Pivot points are a versatile tool in technical analysis, used to identify potential support and resistance levels in the forex market. There are several types of pivot points, each with its own unique calculation method and application:
- Classical Pivot Points: The most widely used method, classical pivot points are calculated using the previous day’s high, low, and close prices. This method provides a straightforward way to determine the central pivot point and associated support and resistance levels.
- Camarilla Pivot Points: This method employs a different formula, making it more suitable for short-term trades. Camarilla pivot points focus on the previous day’s high, low, and close prices to establish tighter support and resistance levels, which can be particularly useful for intraday trading.
- Woodie Pivot Points: Woodie pivot points give more weight to the closing price in their calculation. This method can provide a different perspective on support and resistance levels, often aligning more closely with the closing price’s influence on market sentiment.
- Fibonacci Pivot Points: Utilizing the Fibonacci sequence, this method calculates pivot points and support and resistance levels based on Fibonacci retracement levels. This approach can help traders identify key levels that align with natural market movements.
- Central Pivot Range (CPR): The CPR method calculates pivot points using the previous day’s high, low, and close prices, as well as the current day’s high and low prices. This method provides a broader range of support and resistance levels, offering a comprehensive view of potential market movements.
Each type of pivot point offers unique insights and can be chosen based on the trader’s specific needs and trading style.
Why use this Pivot Points High Low Indicator?
The Pivot point levels can be used as support/resistance to spot the reversal, continuation, stop-loss, and profit targets.
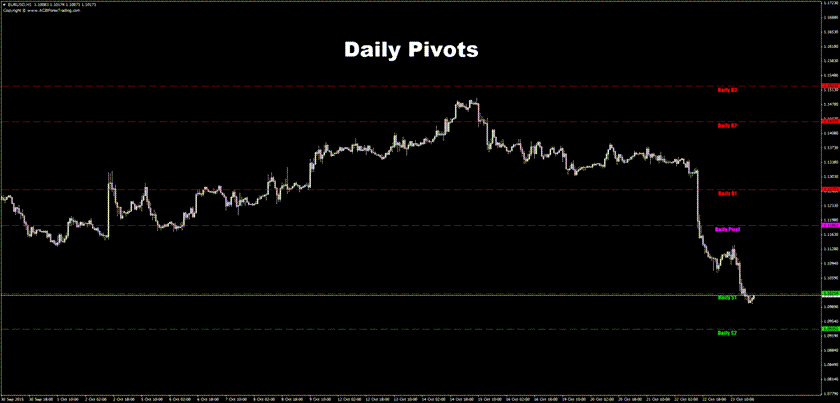
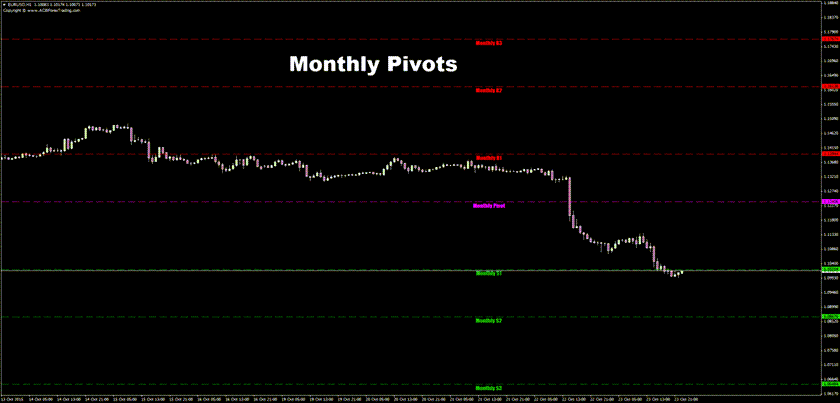
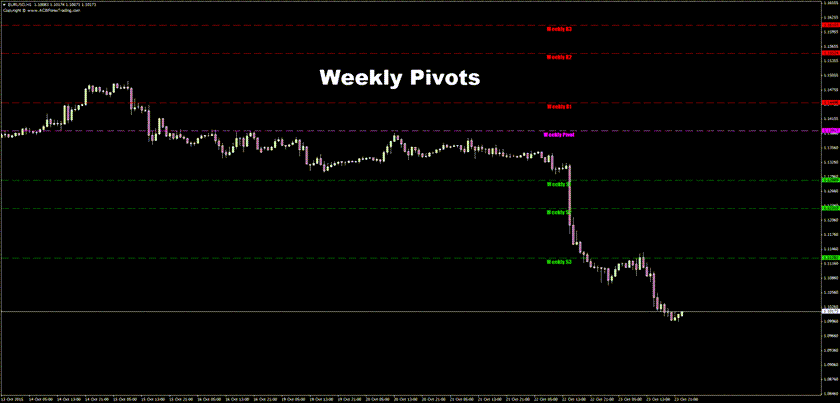
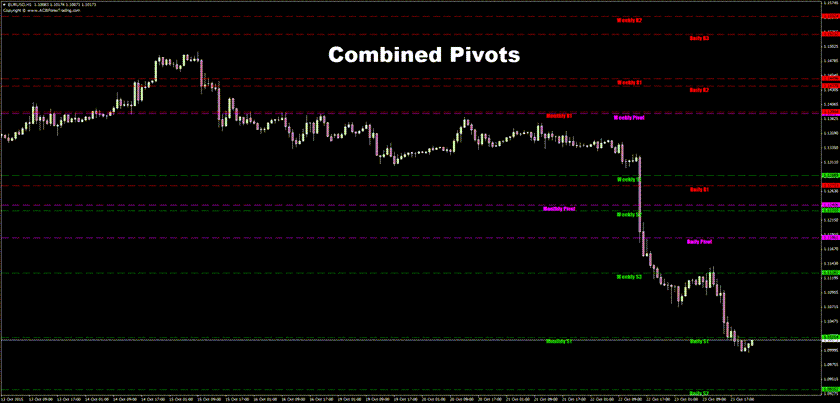
Day traders can use the daily pivot levels, swing traders can use weekly, and long-term investors can use monthly pivot levels. Positional traders and investors can use annual data to estimate significant levels for upcoming years.
How to Use Pivot Points
Pivot points are a powerful tool for making informed trading decisions. Here are some common ways to use pivot points effectively:
- Identify Support and Resistance Levels: Pivot points help identify potential support and resistance levels in the market. These levels can be crucial for setting stop-loss orders or take-profit targets, providing clear points of reference for managing trades.
- Determine Trend Direction: By observing the price relative to the pivot point, traders can gauge the market trend. If the price is above the pivot point, it indicates a bullish trend, while a price below the pivot point suggests a bearish trend.
- Identify Reversal Points: Pivot points can signal potential reversal points in the market. When the price reaches a pivot point and reverses direction, it can indicate a possible trend change, offering opportunities for strategic entry or exit.
- Set Entry and Exit Points: Traders can use pivot points to set precise entry and exit points for their trades. For instance, entering a long position at a support level and exiting at a resistance level can help maximize profits while minimizing risks.
By incorporating pivot points into their trading strategies, traders can enhance their ability to predict market movements and make more informed decisions.
Pivot Indicator Settings
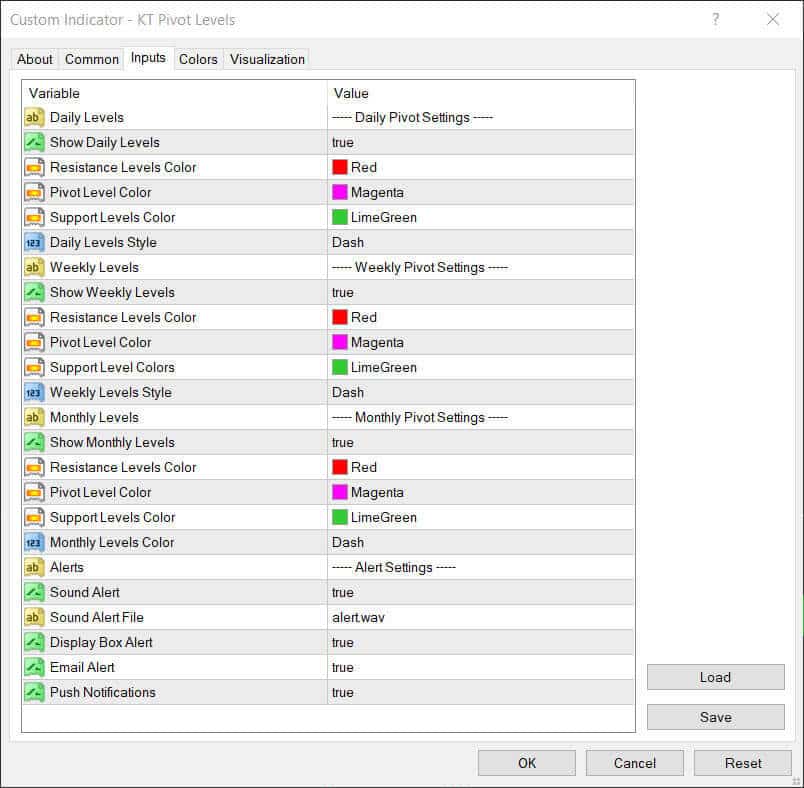
The pivot indicator offers various settings that can be customized to fit individual trading preferences. Here are some common settings to consider:
- Calculation Period: This setting determines the time frame used to calculate the pivot point and support and resistance levels. Traders can choose from daily, weekly, or monthly calculation periods based on their trading style and objectives.
- Calculation Method: The calculation method defines the formula used to determine the pivot point and support and resistance levels. Options include classical, Camarilla, Woodie, and Fibonacci methods, each offering different insights and applications.
- Only the Current Period: This setting allows traders to choose whether the pivot indicator displays only the current period’s pivot point and support and resistance levels or includes multiple periods for a broader perspective.
- Resistance Lines: This setting controls whether the pivot indicator shows resistance lines above the pivot point, helping traders identify potential resistance zones.
- Pivot Lines: This setting determines whether the pivot indicator displays pivot lines below the pivot point, aiding in the identification of support levels.
By adjusting these settings, traders can tailor the pivot indicator to their specific needs, enhancing its effectiveness in their trading strategies.
Trading Strategies for Pivot Line Indicator
Typically, a trader can go long when the price touches the support level and short when it touches the resistance level.
However, this commonly used strategy is dangerous during strong trending markets. Therefore, it's always best to identify the trend direction first using the moving averages.
The pivot levels can be used in a more meaningful way. If the price is below the central pivot level, the market is expected to go south and go north if the price is above the pivot level.
Any indicator or methodology cannot exist without its pitfalls. For example, pivot levels sometimes may fail you as a trader. Still, using them as a guiding compass within your trading strategy is always best.
To know more about the Pivots, read our detailed blog post - A Pivot Points Forex Trading Strategy.
Pivot Points for Range Bound Trading
Most of the time, financial markets are not trending but move in consolidation so that we can use the Pivot Point indicator for range-bound trading.
With a formation of candlestick patterns or price action near S1 S2 S3 or R1 R2 R3, we can enter a long or short trade. A moving average should be used to identify the primary trend direction for further confirmation.
The entries made around the pivot points, high or low (S3 or R3), are more accurate than those made at other pivot levels.
Advanced Pivot Point Techniques
For traders looking to refine their strategies, advanced pivot point techniques can provide additional insights. Here are some common methods:
- Using Pivot Points with Trendlines: Combining pivot points with trendlines can help identify potential support and resistance levels more accurately. Trendlines can confirm the significance of pivot points, providing stronger signals for trading decisions.
- Using Pivot Points with Fibonacci Levels: Integrating pivot points with Fibonacci retracement levels can enhance the identification of key support and resistance zones. This combination leverages the natural market movements indicated by Fibonacci levels.
- Using Pivot Points with Moving Averages: Pivot points can be used alongside moving averages to identify potential support and resistance levels. Moving averages can help confirm the trend direction, making pivot points more reliable.
- Using Pivot Points with RSI: The Relative Strength Index (RSI) can be used in conjunction with pivot points to identify overbought and oversold conditions. This combination can provide early signals of potential reversals, improving trade timing.
By incorporating these advanced techniques, traders can develop more sophisticated and effective trading strategies, leveraging the strengths of multiple technical analysis tools.
How Reliable are Pivot Points in Forex trading?
The pivot points are calculated using the daily, weekly, and monthly time frames. As a result, they offer one of the most accurate methods in technical analysis as the smaller time frames are full of noisy data.
The free pivot points indicator is available on the internet, but it usually needs to be better and is full of bugs, as checked by our team.
Conclusion
Pivot points are a powerful tool in technical analysis, offering valuable insights for making informed trading decisions. By understanding the different types of pivot points, how to use them, and how to adjust the pivot indicator settings, traders can gain a competitive edge in the forex market.
Advanced pivot point techniques, such as combining pivot points with other technical analysis tools, can further refine trading strategies and improve trading results. Embracing these methods can help traders navigate the complexities of the forex market with greater confidence and precision.


