Gilbert Raff, a renowned name in the field of financial market analysis, is the developer of the Raff Regression Channel.
This technical tool is designed for discerning and validating possible market price trends.
It works by sketching a linear regression line through the midpoint of selected price ranges and framing two equidistant lines on either side of the regression line.
Understanding the Raff Regression Channel
Establishing the Starting and Ending Points
The initial phase of the Raff Regression Channel involves identifying the beginning and concluding points.
A substantial peak and trough in the price range often determine these points.
The most recent peak and troughs are typically chosen as the start and end points.
Charting the Linear Regression Line
Once the start and end points are defined, the next move involves plotting the linear regression line.
This axis line traverses the midpoint of the prices between the start and end points and forms the backbone of the Raff Regression Channel.
The line is computed to minimize the overall distance from each price point within the chosen range.
Forming the Parallel Lines
The final step involves drawing two parallel lines furthest from the regression line.
These two lines form the upper and lower boundaries of the Raff Regression Channel.
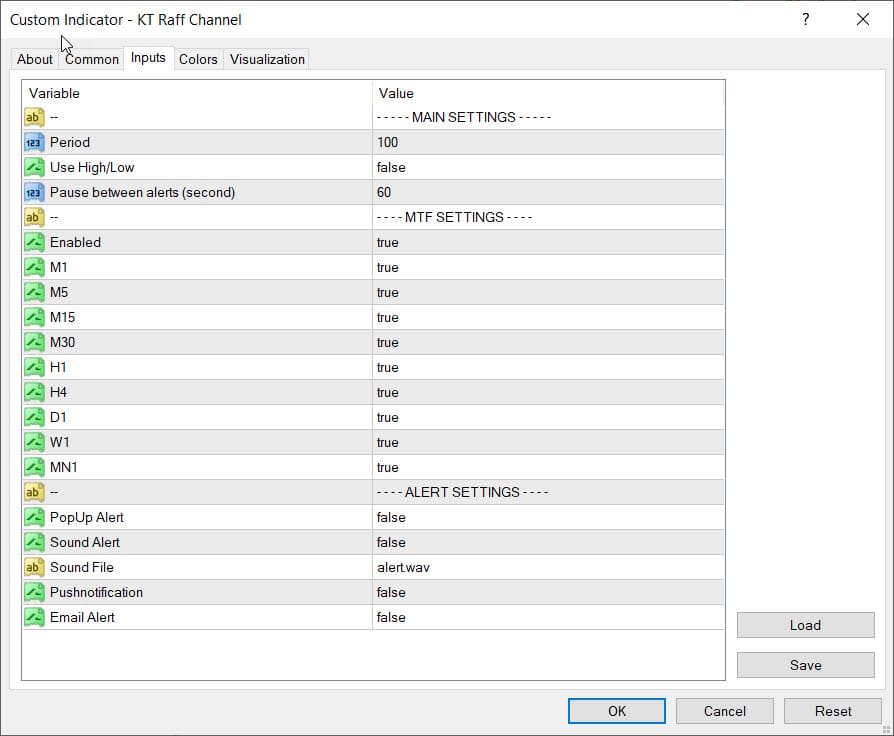
Inputs
Exploring the KT Raff Channel Indicator
KT Raff Channel indicator offers a more advanced interpretation of Gilbert Raff's original tool, integrating the first-order regression into the midline of the trend channel.
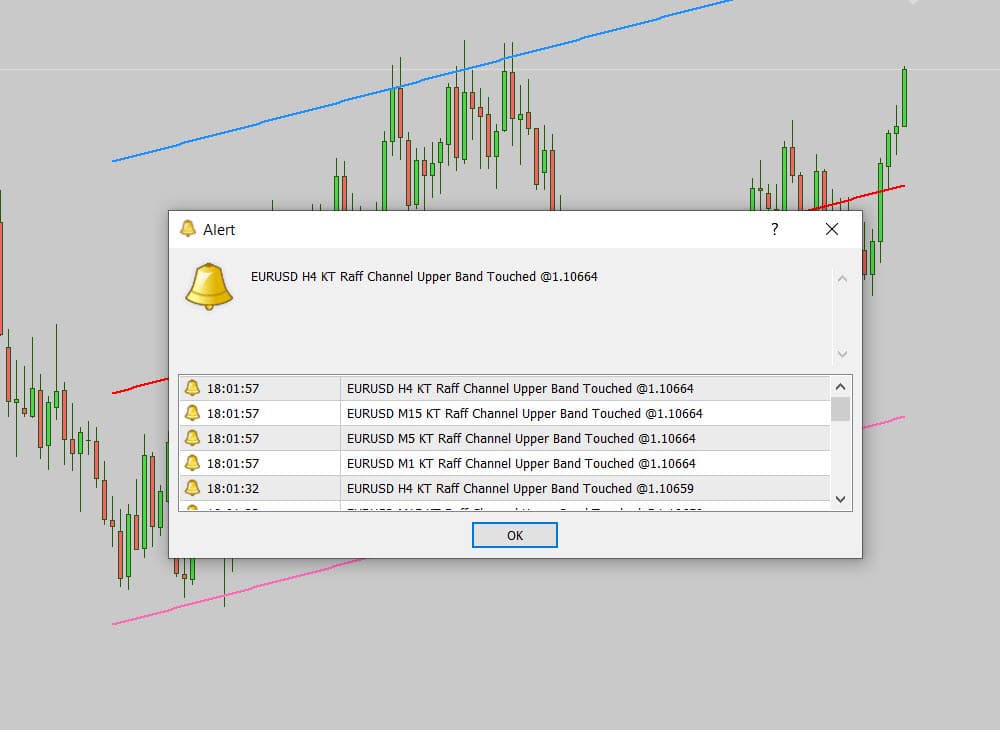
This channel's upper and lower lines then serve as support and resistance points.
Therefore, any price fluctuation outside or along the channel lines could signify a trend reversal.
These channel extremities thus provide ideal entry points for BUY or SELL trades.
Yet, a persistent breakout beyond these channel lines might indicate the reversal of the current market trend.
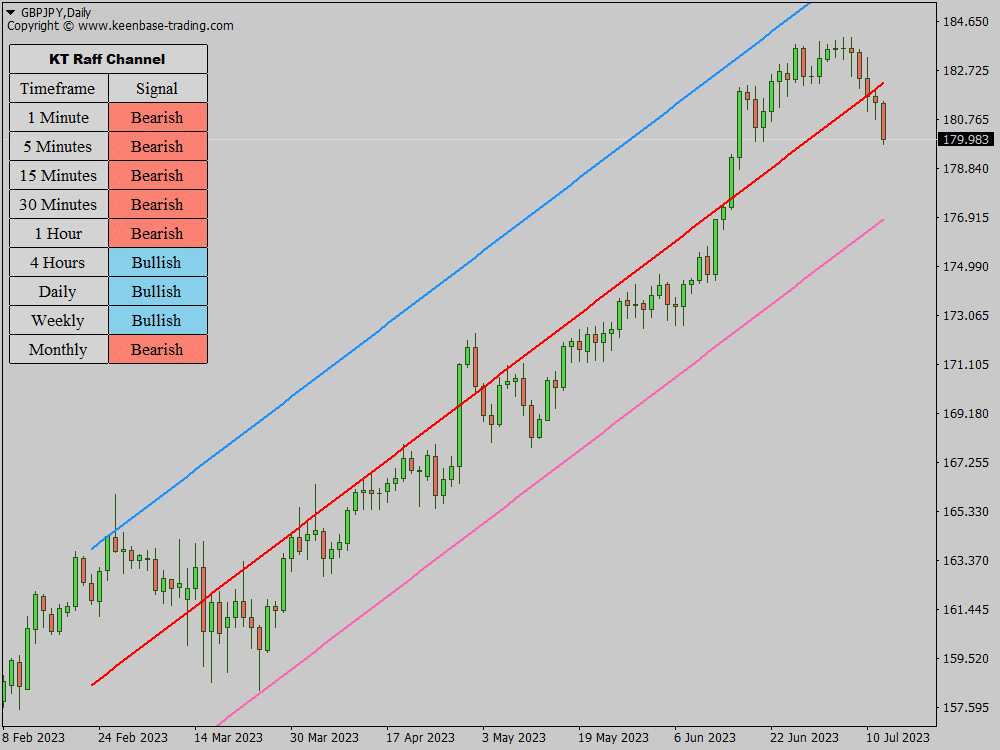
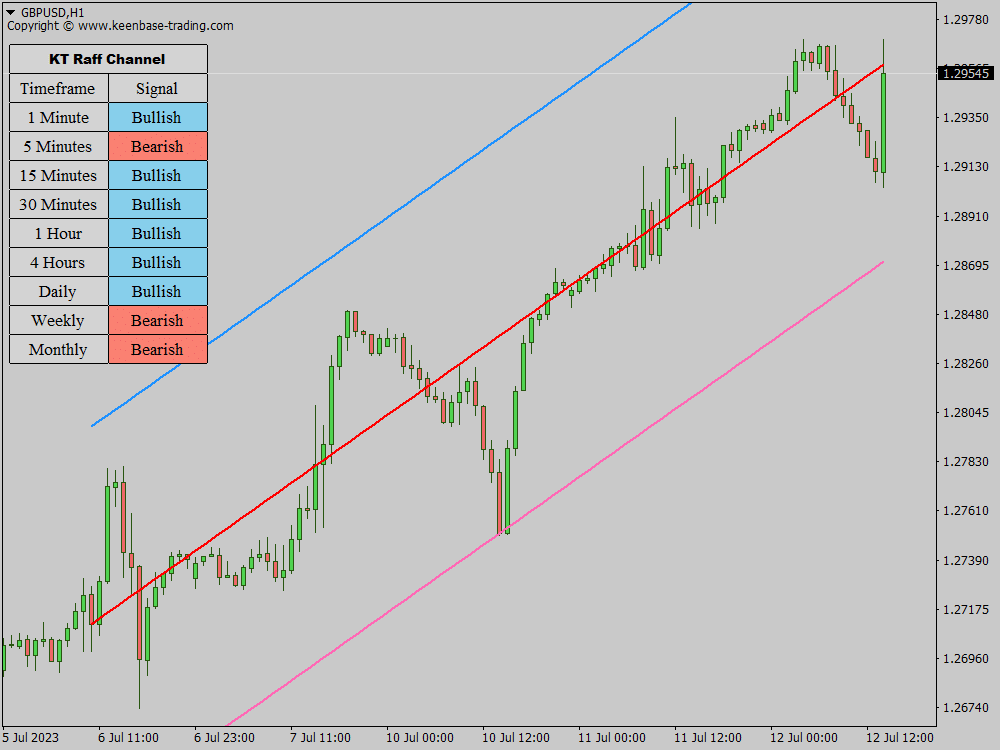
Visualizing the KT Raff Channel Indicator
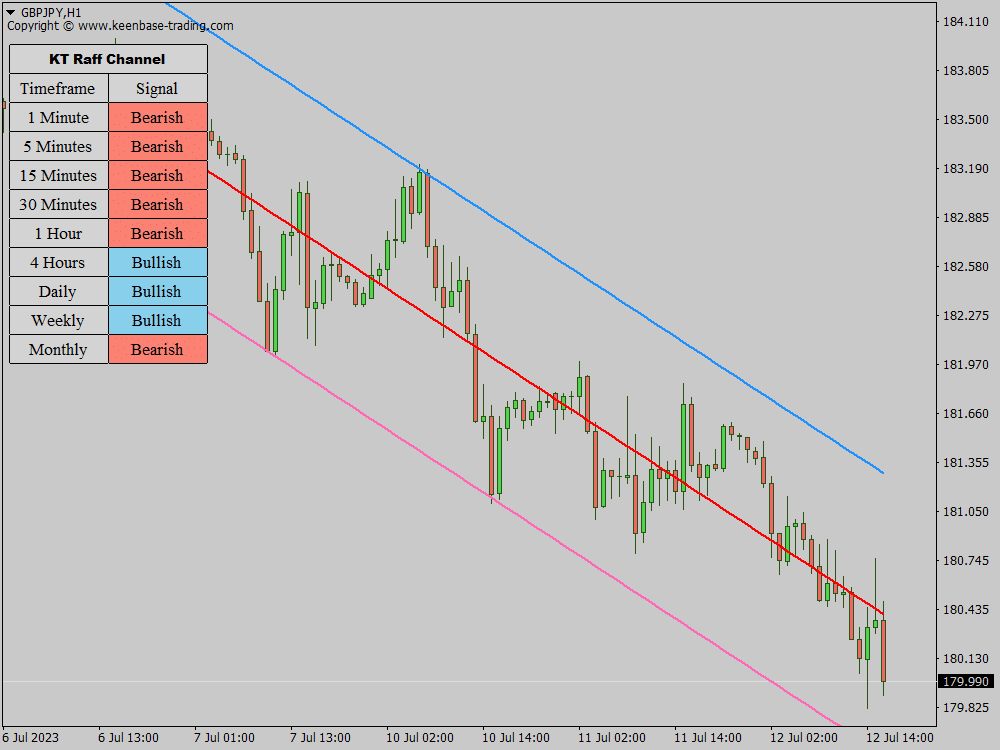
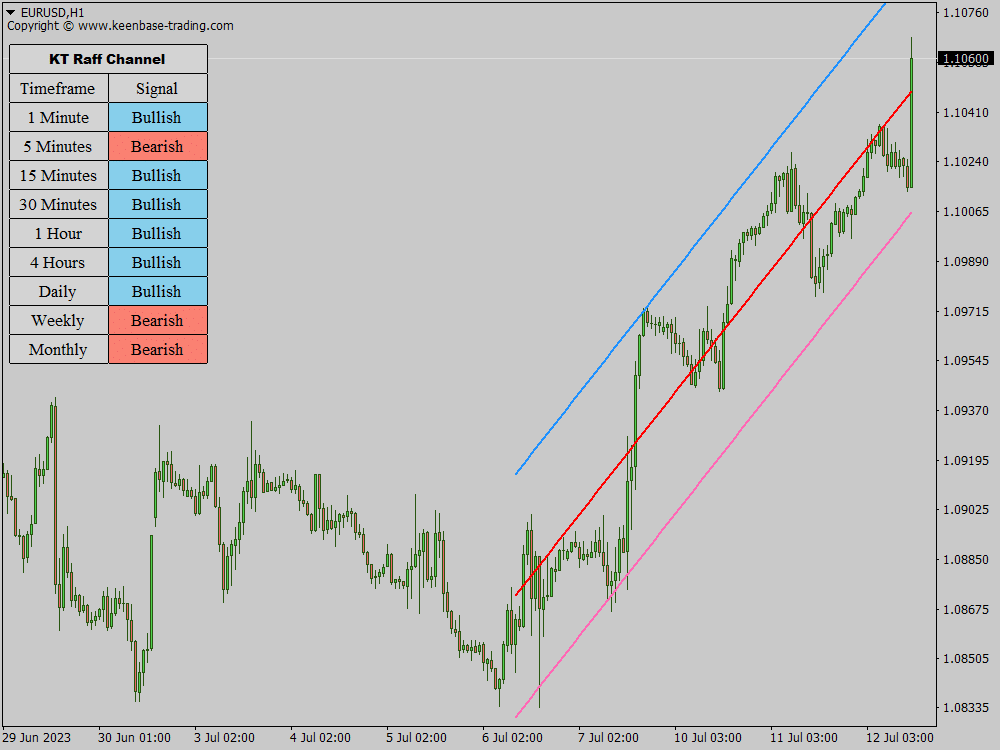
Typically, the upper channel line is demarcated in blue, the red midline, and the pink lower channel line.
Blue and pink lines represent the channel boundaries, while red indicates the trend direction.
An ascending red line represents a bullish market trend, whereas a descending red line signals a bearish price trend.
Trading The Forex Market Using The KT Raff Channel Indicator
The extreme channel levels present the optimal entry points within a forex trading strategy.
On an uptrend, you may initiate a BUY at the pink line, placing the stop loss at the previous swing low and targeting the opposite channel line for a profitable exit.
On the other hand, in a bearish market, the blue line provides an excellent entry point for a SELL trade.
Here, you can set a stop loss at the previous swing high, aiming for an exit at the lower channel line.
Why Use The KT Raff Channel Indicator
The indicator is relatively straightforward to trade with, making it suitable for novice and seasoned traders. This indicator operates across all intraday time frames like daily, weekly, and monthly charts.
Trend Identification
KT Raff Channel indicator helps traders identify and confirm market trends with ease. By interpreting the direction of the midline, traders can quickly determine whether the market is experiencing a bullish or bearish trend.
Entry and Exit Points
KT Raff Channel indicator marks the best entry points for trades at the extreme levels of the channel, making it simpler for traders to strategize their buy or sell decisions. This clear distinction helps in optimizing profits and reducing losses.
Versatility
The indicator works across all intraday timeframes, daily, weekly, and monthly charts. This flexibility allows traders to apply it according to their specific trading strategies, whether short-term or long-term.
User-friendly
KT Raff Channel indicator is not only effective but also easy to use. This makes it suitable for novice traders looking to get started with technical analysis and experienced traders seeking to add a new tool to their arsenal.
Integration with Other Indicators
KT Raff Channel indicator can be used with other trading indicators to strengthen market analysis. This comprehensive approach can enhance trading strategies and lead to more successful trades.
Easy to Install
One of the main advantages of the KT Raff Channel Indicator is that it is super easy to download and install, making it accessible to all traders. Even those with a limited budget can benefit from advanced market analysis tools.
Bottom Line
KT Raff Channel Indicator for MT4 stands as a comprehensive trend trading indicator.
As it proposes that the best entry points are at the extremes, it offers fewer yet more effective and successful trades.
It's worth noting that, like all indicators, the Raff Regression Channel is not an absolute tool and should be utilized alongside other market assessments and credible indicators like Commodity Channel Index to substantiate signals and prevent potential false alarms.
Conveniently, the indicator can be downloaded and installed easily, making it an essential tool in any trader's kit.
As always, testing the indicator on a demo account before applying it to the live markets is recommended.
