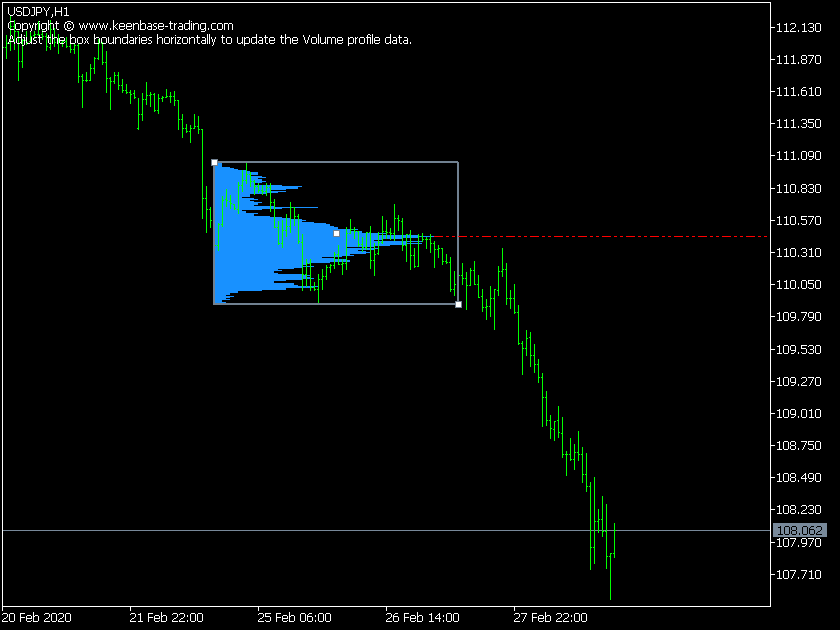
The Point of Control (POC) Level
POC represents a important price level that coincides with the highest traded volume within the whole volume profile MT4 indicator histogram.
POC is mainly used as a support/resistance or a fundamental price level where the market retests before going in a specific direction in a trading session.
Features of KT Volume Profile Indicator
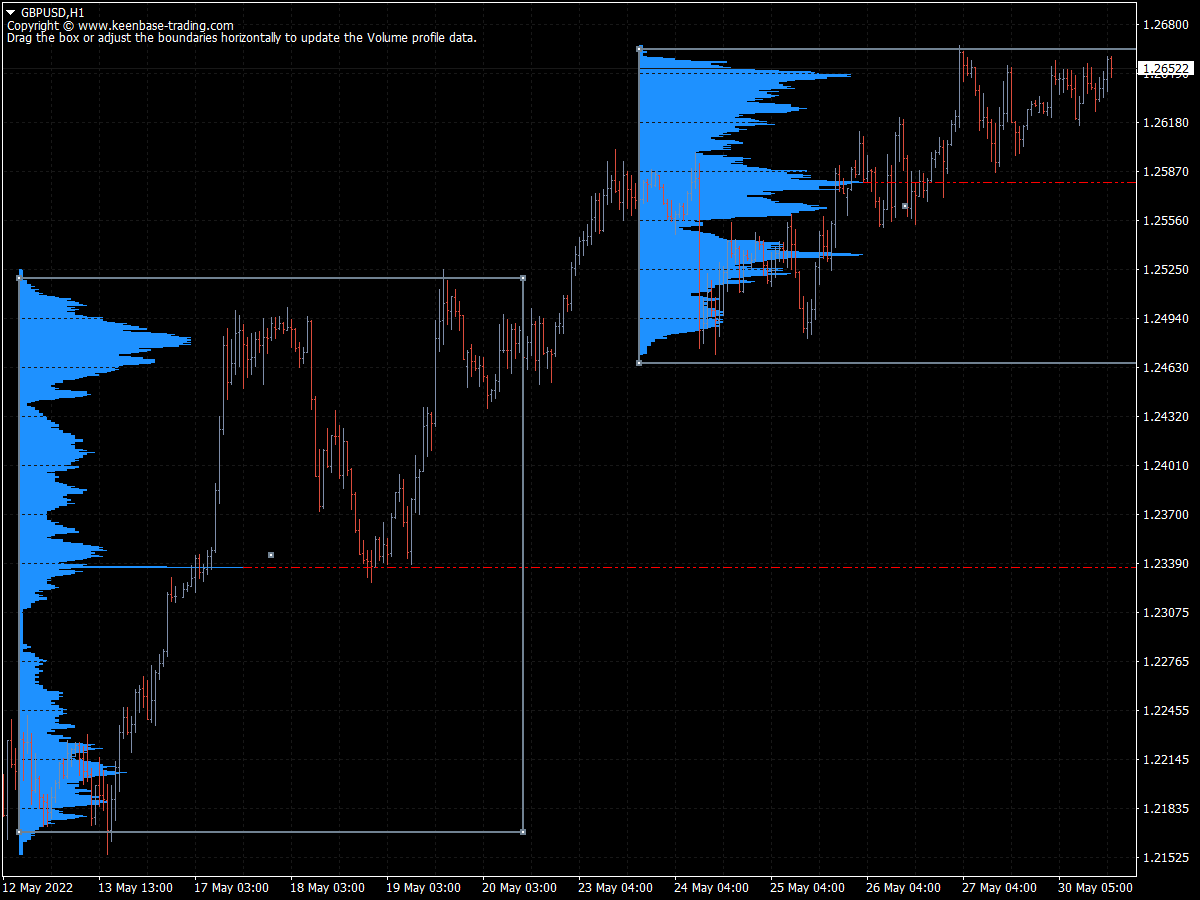
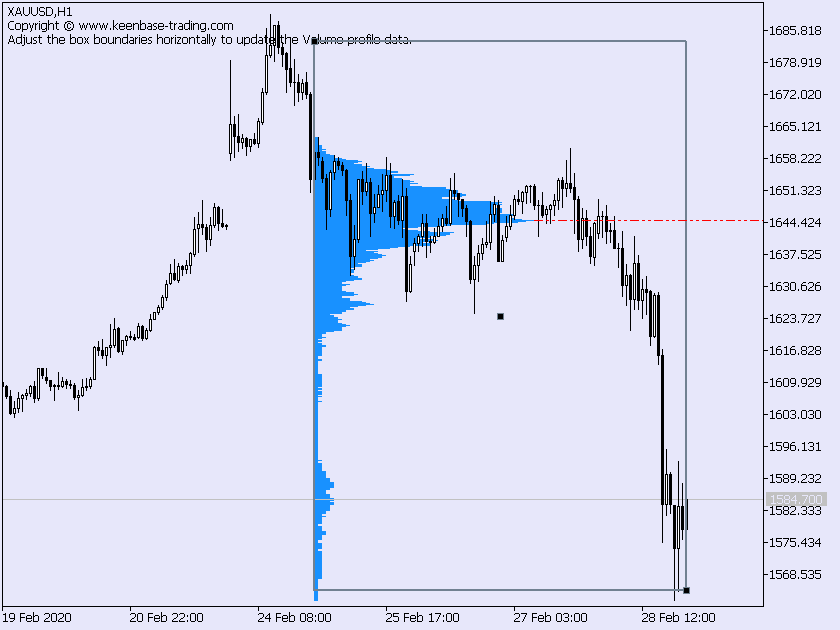
- It's very convenient and easy to use. Just drag n drop the rectangle anywhere on the chart to update the volume profile data in real-time.
- It supports multiple volume profiles to facilitate the technical analysis on previous days.
- It can provide alerts when the price crosses the POC.
- Coded from scratch uses the least CPU resources and memory.
- The KT Volume Profile indicator is compatible with MT4 and MT5 trading platforms, making it a versatile tool for traders.
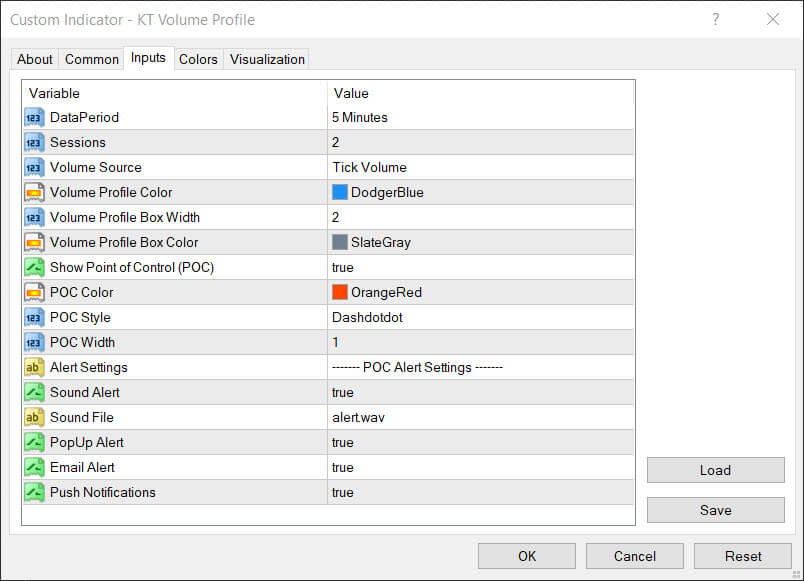
Input Parameters
- Volume Source: Tick Volume/Real Volume.
- Volume Profile Color: Color of the volume profile histogram.
- Volume Profile Box Width: Width of the rectangle box.
- Volume Profile Box Color: Color of the rectangle box.
- Show Point of Control (POC): true/false
- POC Color: The color of the POC level.
- POC Style: The lines style and appearance of the POC level.
- POC Width: The width of the POC level.
- Alert Settings: self-explanatory.
What is the Volume Profile Indicator?
The Volume Profile indicator is a powerful technical analysis tool that displays the amount of volume traded at each price level over a specified time period. Also known as the Volume Profile or VPVR, this indicator is visually represented on a chart as a histogram.
The horizontal axis of the histogram corresponds to price levels, while the vertical axis represents the volume traded at those levels. By using the Volume Profile Indicator, traders can identify key support and resistance levels, as well as uncover potential trading opportunities.
This tool provides a unique perspective on market activity, making it an invaluable asset for traders looking to understand the dynamics of trading volume at different price points.
Understanding Volume Profile
A Volume Profile is essentially a graphical representation of trading activity at various price levels over a specific time period. It illustrates the distribution of volume at each price level, enabling traders to pinpoint areas of high and low trading activity.
By analyzing the Volume Profile, traders can gain insights into the market structure, identify crucial levels, and make informed trading decisions. This tool is particularly useful for recognizing potential trading opportunities, as it offers a distinct view of market behavior that traditional price charts may not reveal.
Whether you’re a novice or an experienced trader, understanding the Volume Profile can significantly enhance your ability to navigate the markets.
Key Components of Volume Profile
The key components of a Volume Profile include several critical elements that help traders interpret market activity:
- Volume Nodes: These are areas along the profile that indicate relatively high or low volume. They help identify where significant trading activity has occurred.
- Point of Control (POC): This is the single price level with the highest total volume traded. It often serves as a crucial support or resistance level.
- Value Area: This range of prices contains a set percentage of the total volume, typically 70%. It highlights the most actively traded price levels.
- High Volume Nodes (HVNs): These are upper levels with relatively high volume, indicating areas of price acceptance.
- Low Volume Nodes (LVNs): These are lower levels with relatively low volume, indicating areas of price rejection.
- Open: The price at which trading began for the period.
- Close: The final price at the end of the period.
Understanding these components allows traders to better analyze market trends and make strategic trading decisions based on volume distribution.
How to use Volume Profile in your Trading Strategy
During an active trading day, there could be a decisive price action when the price touches the Point on Contol (POC) level. Using this information, you can use the our flexible Volume Profile indicator MT5 as follows:
- If the entry price is above the POC, you can use the POC as a stop loss level, or if the entry price is below it, you can use the POC as a profit target.
- The volume point, or Volume Point of Control (VPOC), is crucial for identifying key price levels within the volume profile chart, acting as pivotal areas for support and resistance.
- In Forex trading, you can look for some candlestick patterns near the POC level as they often provide a strong indication of an upcoming reversal.
- It can be very effective when used in a trading strategy that uses the Daily time frame. For example, when a trading day opens that lies outside of the volume profile visible range, it can be a strong indication of the trend continuation.
- In a bullish or bearish market, the area of high session volume can be used to find the retracement or pull-back zone.
The volume profile chart is an essential tool for analyzing market dynamics, helping traders identify key support and resistance levels and interpret market behavior effectively.
Combining Volume Profile with Other Indicators
The Volume Profile Indicator can be even more effective when combined with other technical indicators. Here are some popular combinations:
Oscillators: Indicators like the Relative Strength Index (RSI) or the Moving Average Convergence Divergence (MACD) can help confirm overbought or oversold conditions, adding another layer of analysis to the Volume Profile.
Moving Averages: These can help define the overall trading bias and identify trends, making it easier to interpret the Volume Profile in the context of broader market movements.
Trend Indicators: Tools such as the Average Directional Index (ADX) or the Parabolic SAR can be used to gauge the strength and direction of a trend, complementing the insights provided by the Volume Profile.
By integrating the Volume Profile Indicator with these additional tools, traders can develop a more comprehensive and robust trading strategy.
Tips for Effective Use
To make the most of the Volume Profile Indicator, consider the following tips:
Identify Key Levels: Use the Volume Profile to pinpoint key support and resistance levels that can guide your trading decisions.
Confirm Signals: Look for areas of high volume to confirm trading signals and validate potential entry or exit points.
Leverage the POC: The Point of Control (POC) is a critical level to trade around, offering insights into where the most significant trading activity has occurred.
Combine with Other Indicators: Enhance your trading strategy by combining the Volume Profile with other technical indicators for a more holistic analysis.
Analyze Market Structure: Use the Volume Profile to understand the market structure and identify potential trading opportunities based on volume distribution.
Monitor the Value Area: Keep an eye on the Value Area, as it provides valuable insights into market sentiment and the most actively traded price levels.
Utilize HVNs and LVNs: High Volume Nodes (HVNs) and Low Volume Nodes (LVNs) can help identify areas of price acceptance and rejection, respectively, aiding in your trading decisions.
By following these tips, traders can effectively utilize the Volume Profile Indicator to enhance their trading strategies and make more informed decisions.
Volume Profile Structures
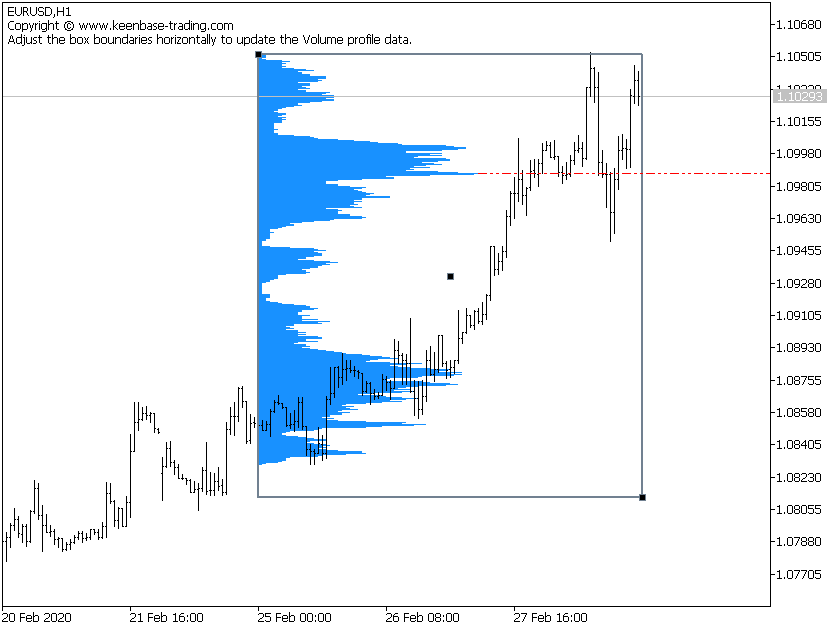
- Uniform Volume Distribution: In a uniform distribution, the volume data is scattered uniformly throughout the volume profile histogram. It usually happens when there is a balance between the buyers and sellers.
- Non Uniform Volume Distribution: The volume data is non-uniformly distributed, and it usually happens when there is an imbalance between the buyers and sellers.
- There are also various volume profile shapes such as short L-shape, short P-shape, long L-shape, and long P-shape.