David H. Weis, a 40-year advanced student, and expert in the Wyckoff Method, created the Weis Wave indicator.
David's sophisticated personal research led him to develop the Weis Wave, derived from Richard D. Wyckoff's excellent Tape Reading Techniques. The Weis Wave organizes market volume and price into wave charts.
Source: Wyckoff Analytics
Features
- The indicator provides price waves and volumes for any market.
- It assists in determining the trend's direction as well as its strength.
- You can customize the settings and color schemes to your preferences.
- It works in all time frames.
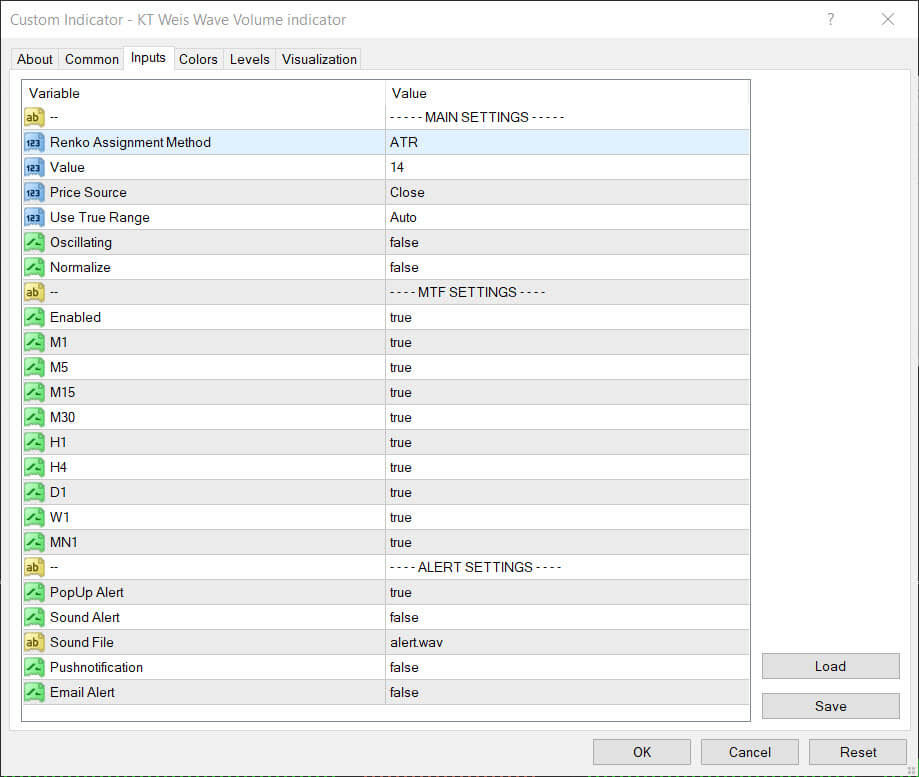
Inputs
How the KT Weis Wave Volume Indicator Works
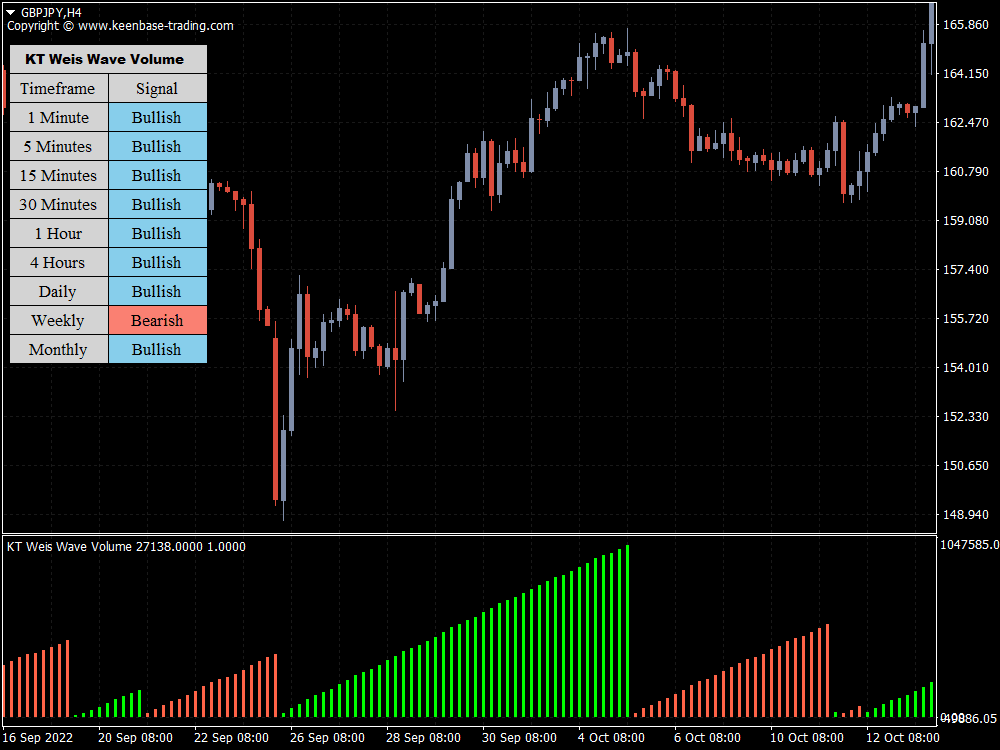
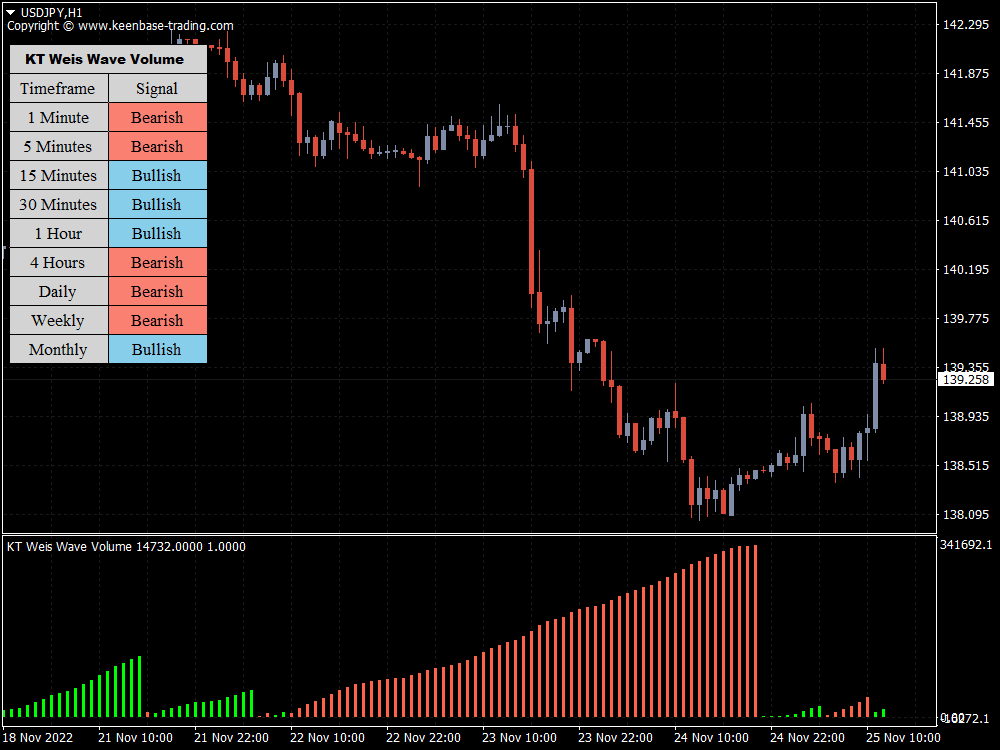
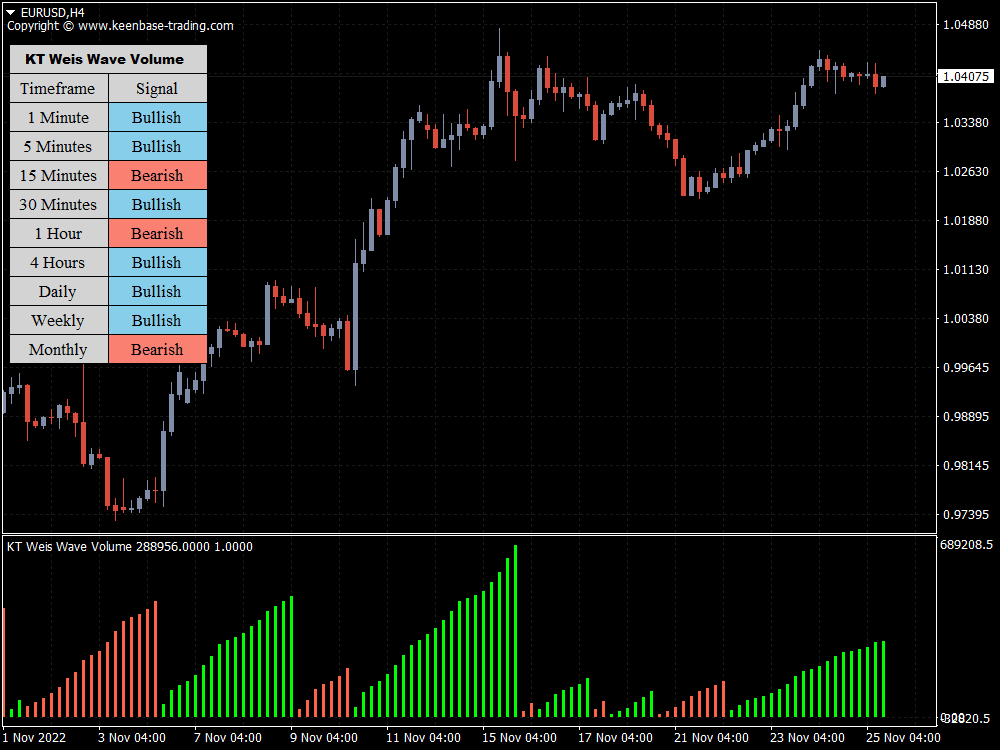
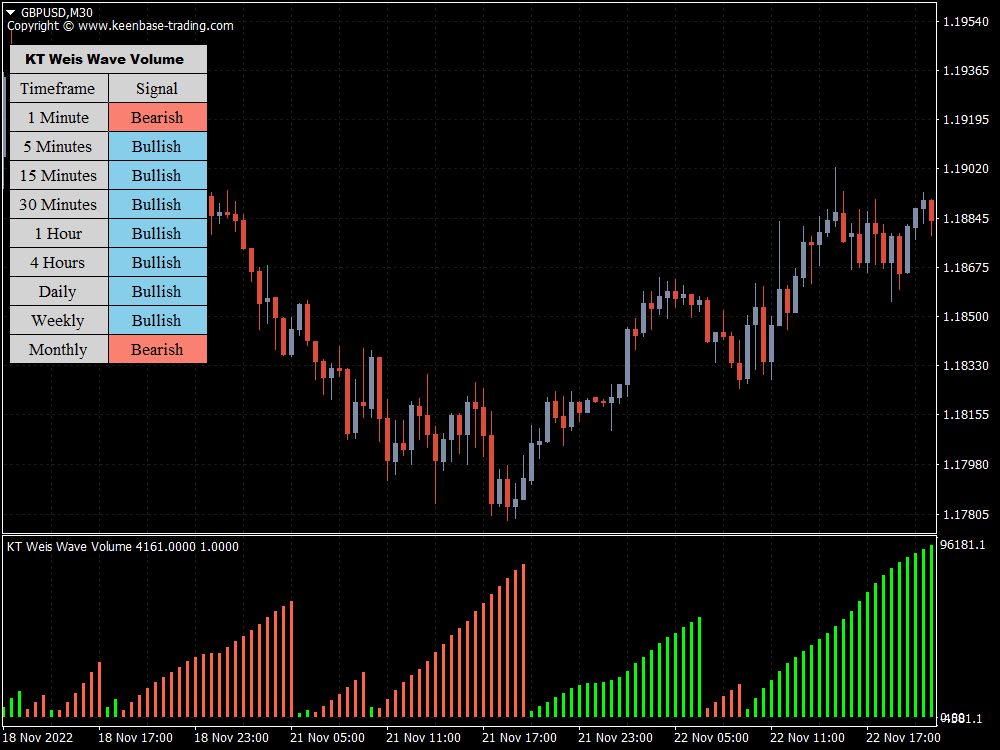
The Weis Waves volume sums up the wave volumes in each wave. This is how we receive a bar chart of cumulative volumes of alternating waves.
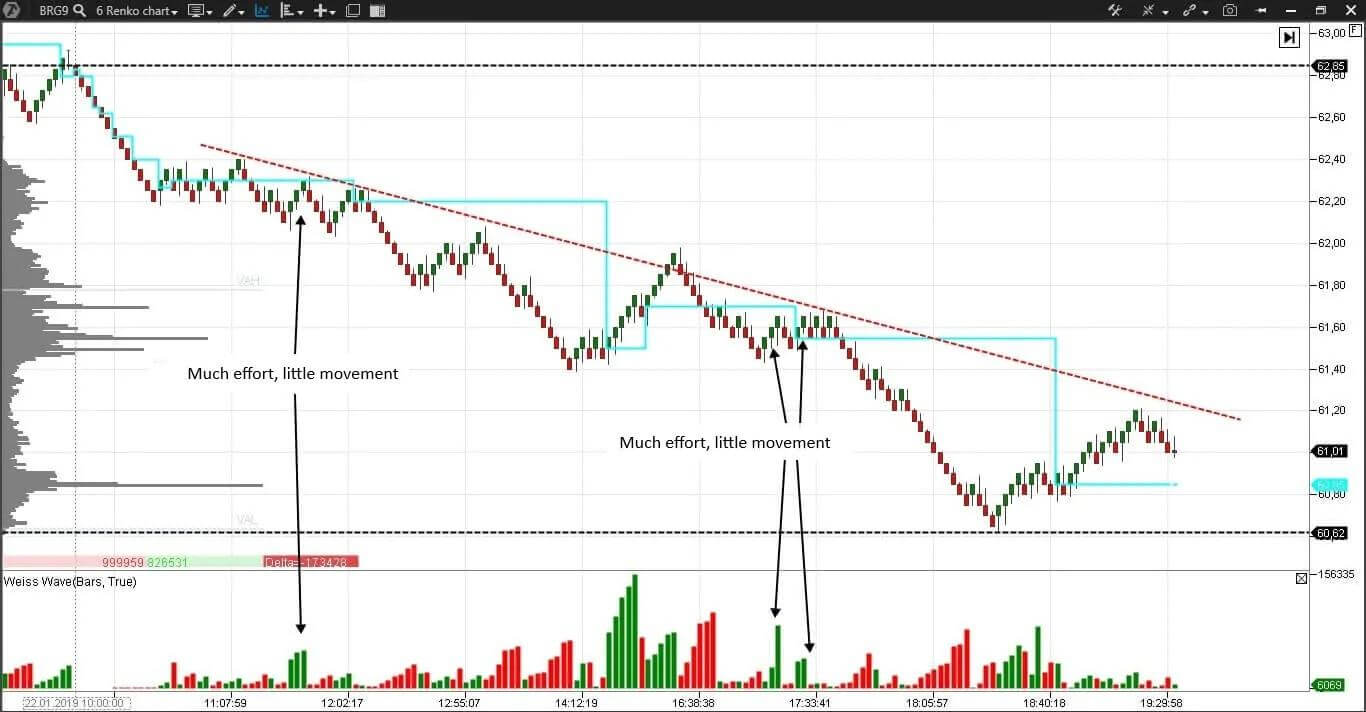
Namely, the cumulative volume makes the Weis Wave charts unique. It allowed for comparing the relation of the wave sequence characteristics, such as the correspondence of the applied force (expressed in the volume) and the received result (on the price bar).
The arrows mark the buyers’ efforts to resist the downward trend. Every time the volume was significant, compared to previous waves, but the price moved upward slowly.
The Weiss Wave charts display the trend movement reversals and turning points in the market.
An individual wave is measured by:
- Length, which is a time-related characteristic.
- Volume, which measures the intensity of activity.
- Height, which measures price action progress.
Having compared the characteristics of each wave concerning the previous or next one, you can receive information about the general state of the whole market.
Where the Weis Waves Volume Works Best
David Weis experimented a lot with the Wyckoff point-and-figure charts. He was interested in two parameters:
- How to select the reversal size
- How to identify the accumulation line – the price balance area, which could become a starting point of focused movement
Weis chose the Renko and tick charts as the most appropriate for the wave analysis.
Weis wrote that Renko charts coincide with the original Wyckoff tape reading charts more than other charts since they do not depend on time period. “… Renko charts offer peace of mind. They reduce the number of decisions”.
How to Analyze the Chart with the KT Weis Wave Volume
There are the following intraday situations that emerge when using the Weis Waves volume:
- Shortening of the thrust;
- Consolidation;
- Springs and upthrusts;
- Correlation of effort and reward;
- Ease of movement;
- Reduction of waves;
- Divergences.
Potential Application
KT Weis Wave Volume works best with these two trading methods:
The first approach is when the indicator is combined with the exponential moving average (EMA) to confirm the trend. You can apply the following steps when using the indicator with EMA:
- Set the EMA periods to 30 (for example)
- Let the KT Weis Wave Volume indicator confirm the trend as the price crosses the EMA.
- If the price has crossed EMA 30 line from below and the indicator color turns green, open a long position.
- If the price intersects the EMA 30 line from above and the indicator color turns green to red, you can open a short trade.
The second approach is when the indicator is combined with the KT Heiken Ashi. To apply this approach, follow this process:
- First, change the chart type to the Heiken Ashi candlestick pattern, with a 5-minute time frame.
- Enter a long position when the color of the KT Weis Wave volume changes from red to green, and the Aish price chart is all blue.
- When the KT Heiken Ashi chart and Weis Wave Volume turn red, it's time to sell.
Conclusion
The KT Weis Wave Volume indicator is a valuable tool for determining the direction and strength of a trend.
To create a powerful trading strategy, combine the indicator with the EMA or the KT Heiken Ashi candlestick. Then, follow the simple rules, wait for the conditions to be met, and enter a trading position.
Always test new strategies in the demo account first. Then, practice for as long as you need to before moving on to the live one.


