We hope you enjoy reading this blog post.
Become a Pro Trader by using our fine-tuned Indicators and Expert Advisors.
Renko Charts - How to Trade using Renko on Metatrader 4/5
Introduction to Renko Charts
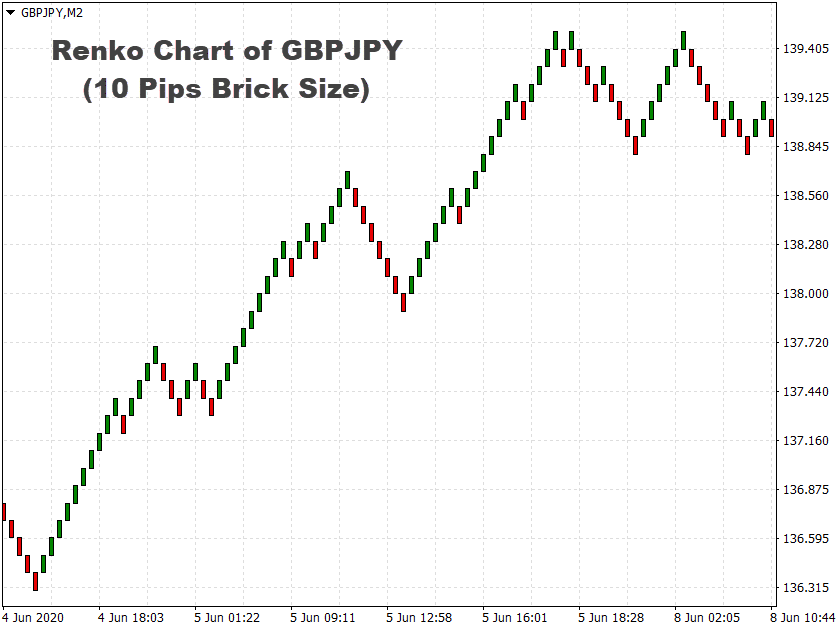
The Renko is a type of technical chart that has been invented in Japan. The word ‘Renko’ is derived from the Japanese word ‘Renga’ which translates to bricks. The Renko chart visually looks like a series of bricks stacked on each other and hence the name.
A new brick is formed every time the price action moves to a specific price. Each of these bricks are positioned at a 45-degree angle in both uptrend and downtrend. A Renko chart typically ignores the time and moves solely based on the price movement.
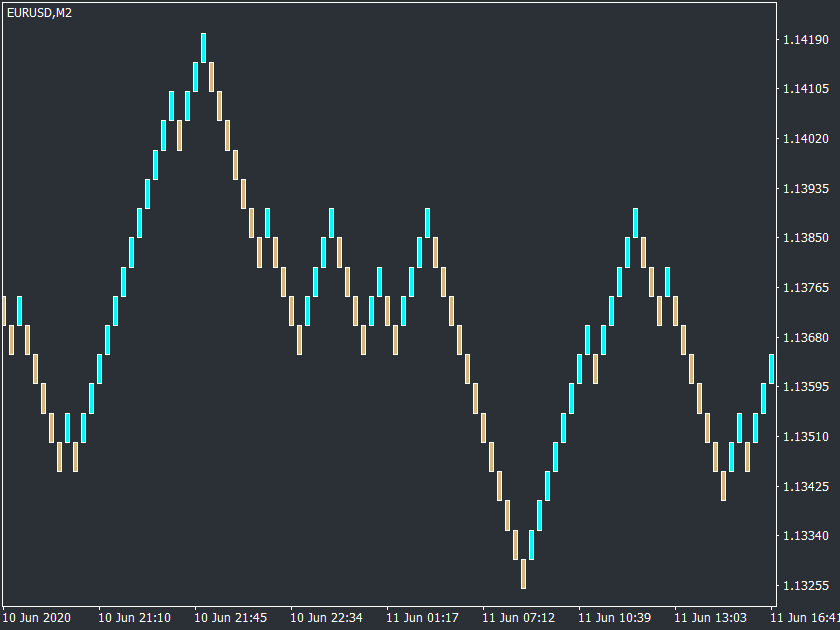
A bullish brick on a Renko chart is colored in Green or White and a bearish brick is colored in Red or Black (depends on the color theme). This chart type filters the minor price movements in the market and this makes it easier for the traders to spot the actual market trend.
Also, the appearance of the Renko chart is more uniform compared to the other chart types. This allows even novice traders to read and understand the price chart clearly. Using these charts, we get to spot the trends, analyze price movements, and find areas of support/resistance, breakouts and reversals.
Good News!
We have developed a unique Renko Patterns indicator that works explicitly on Renko charts to identify some high probability recurring patterns.
The simplicity of the Renko charts attracts all the types of traders. But we should know that simpler the chart, lesser information it contains. This can actually make a difference in our trading activities. Because of its simple nature, traders often use technical tools to support their analysis.
For signal confirmation, we can use indicators like Moving Averages, MACD, RSI, Stochastic etc. These indicators can also be used to measure the momentum of the price which is giving us the bullish and bearish signal.
Renko charts are the best type of charts to use when it comes to identifying significant support and resistance levels. This is because there is a lot less noise in this chat type when compared to a candlestick chart.
Typically, trading signals are generated when the Renko chart changes its direction while changing its color. For instance, after a series of the Green boxes if a Red box is formed, it is clear indication for us to go short.
Setting up the Renko Chart on MT4
Here is the procedure to incorporate Renko offline chart using an Expert Advisor on MT4.
- Expert Advisor to generate Renko chart on MT4: KT Renko Chart Generator(MT4 version)
Step 1
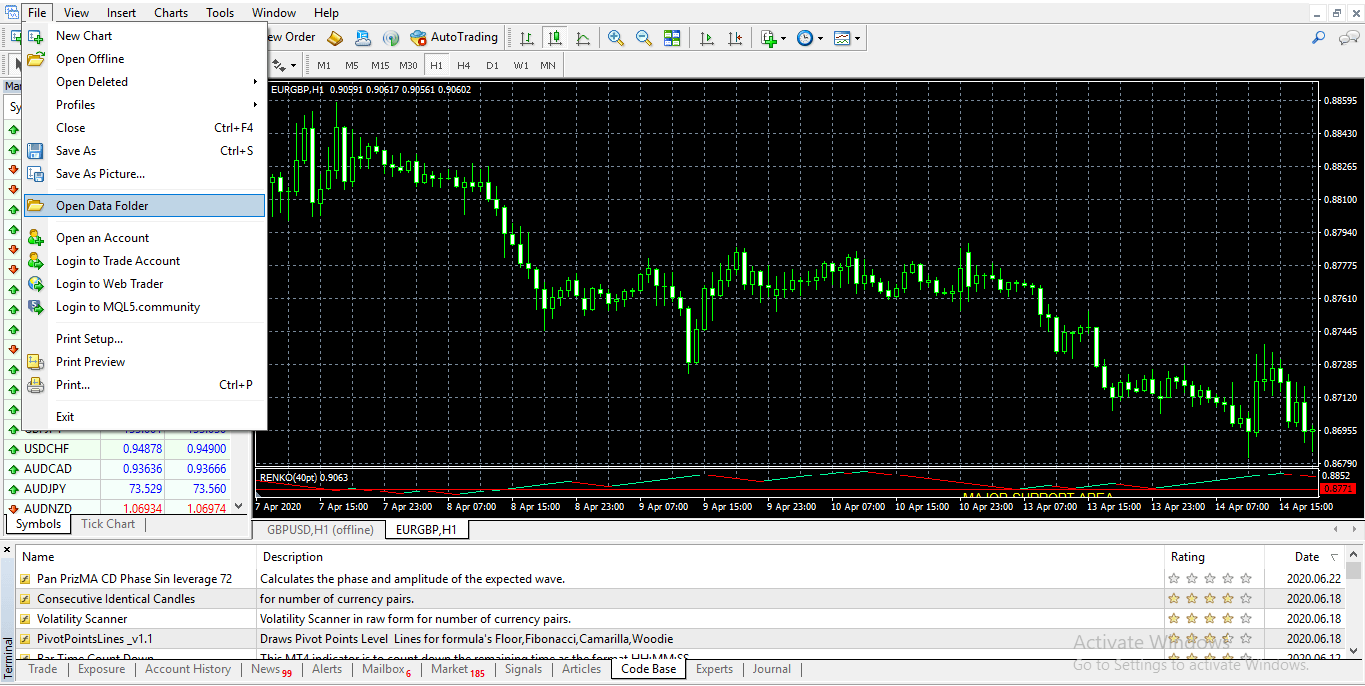
Open the MT4 terminal, and go to File => Open Data Folder. This will take you to the data folder as shown:
Step 2
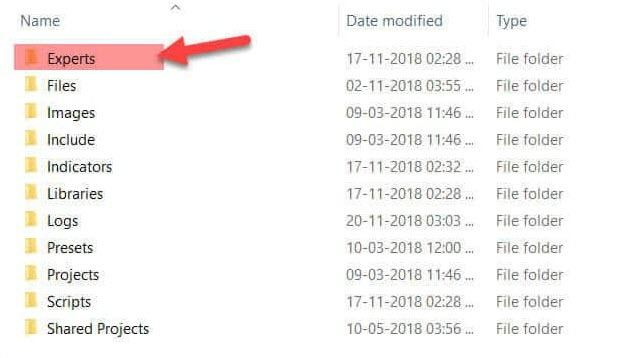
Follow the path: MQL4 => Experts

Step 3
Copy the downloaded file in the "Experts" folder and restart the MT4. This completes the procedure for downloading and installing the Renko offline chart on your MT4.
Step 4
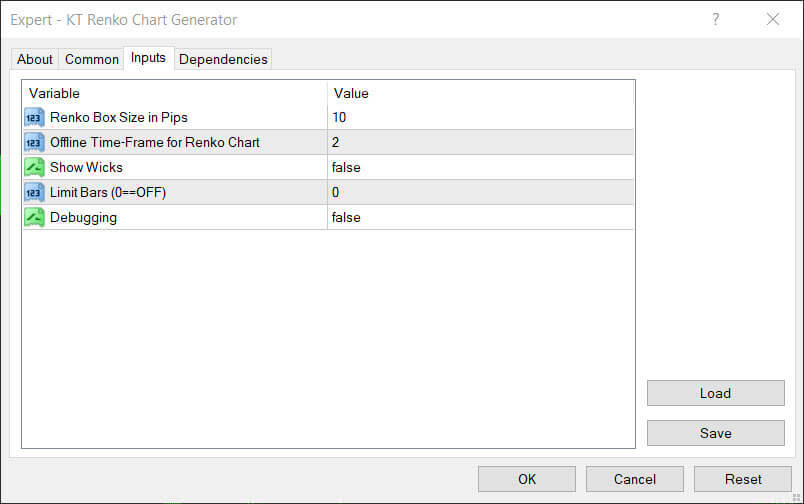
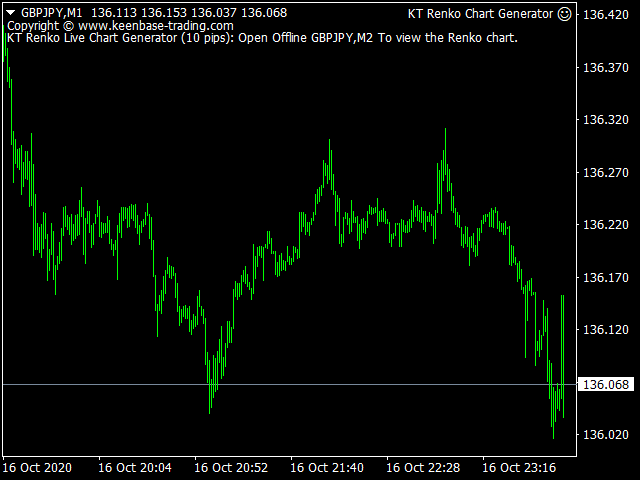
To create a Renko chart, add the "KT Renko Chart Generator.ex4" on the 1-Minute time frame.
Step 5
Click on File => Open Offline => GBPJPY M2
Setting up the Renko Chart on MT5
Expert Advisor for creating Renko chart on MT5: KT Renko Chart Generator(MT5 version)

After copying the downloaded file into MQl5==>Experts folder, restart the MT5 and add "KT Renko Chart Generator.ex5" on the 1-Min time-frame.
It will automatically create and open the Renko chart as a custom symbol.
Renko Based Trading Strategies
Renko Strategy One: Support/Resistance Trading
Renko chart simplifies everything, and as a result, we lose a lot of data, which can significantly affect the technical analysis.
When it comes to finding the significant support and resistance levels, Renko charts stand tall above all the other chart types. Because even while using the most effective candlestick charts, technical traders find it challenging to identify S&R levels as it shows a few fake outs quite often.
But we will never witness these things spikes on the Renko charts.
It is a proven fact that trading near Support and Resistance is a useful trading technique. We must buy at the support and sell at the resistance area.
We believe that you are well versed in S&R trading, so let’s not delve deeper into this topic. Below are some of the live examples of this trading strategy using Renko charts.
Buy Example
The below price chart represents an uptrend in the EUR/GBP Forex pair. During the pullback phase, we can see the price holding at a significant support level. This is an indication for us to go long in this currency pair.
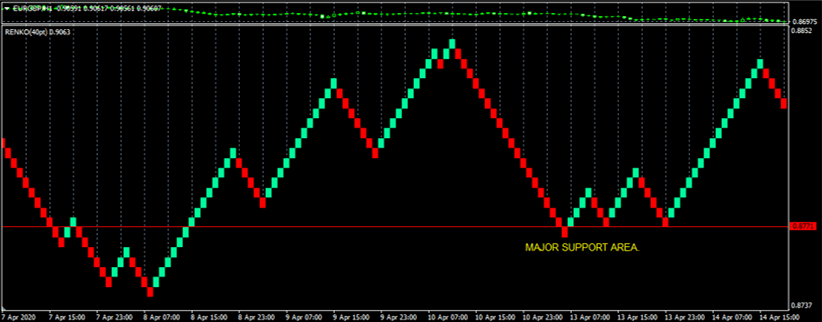
Always remember to place the take-profit order near the most recent higher high and stops just below the support line.
Sell Example
The price chart below indicates an uptrend in the NZD/CAD Forex pair. It was a clear sell signal for us when the price approached a significant resistance level. Right after our entry, the trade performed well as the price shot down to the south, forming a brand new lower low.
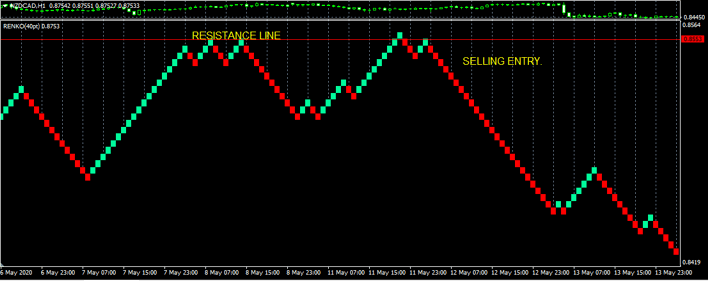
When we catch the trend at the right moment, we can comfortably ride the whole of it. This is the fundamental advantage that Renko charts provide to technical traders.
Renko Strategy Two: Trendline Trading
Trend line trading is one of the most common practices that technical traders follow. They are primarily used to identify the market trend and ascertain significant trading opportunities. Trendlines work like magic on all the types of markets and even on every single timeframe.
Renko charts provide reliable trading opportunities when combined with the trendlines. Below are the real trade examples of trading trendlines using Renko charts in both up trending and down trending markets.
Note: Use this strategy in trending markets alone and not in ranging markets.
Buy Example
In the below Renko chart, we can see that the NZD/CAD pair was in an overall uptrend. The price action hits the trendline thrice in an ongoing trend, giving us three consecutive buy signals.
Every trading opportunity comes only after a pullback. All of our trades hit a new higher high right after our entry.
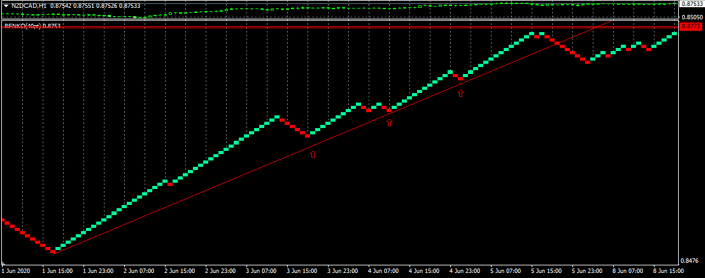
We can go long as soon as the price touches the trendline or wait for a bullish candle to appear for extra confirmation. Close the trades when you see an opposite candle getting formed on the chart.
You can even choose to hold your trades and keep scaling them as in when the opportunity arises. Close your entire positions when the Renko chart breaks the trendline.
Sell Example
The below price chart represents a downtrend in the AUD/NZD Forex pair. Here, the market gave us four opportunities to go short on this pair. The first two trades performed well as they continue to print the new lower lows.
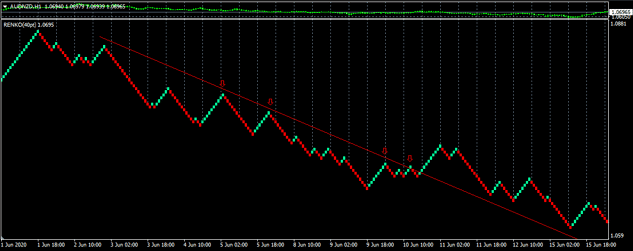
Whereas the third and fourth trades failed to get new lower lows, the price action ended up breaking the trend line. This explains that sellers are losing momentum. Hence closing all the running trades in this pair is a good idea.
Renko Strategy Three: Range Bound Trading
Range bound trading is also a widespread technique in the Forex market. Technical traders across the globe prefer this form of trading to make some quick bucks.
The range is a state of market where buyers and sellers have equal strength. The market ranges when these two parties fight to lead the market.
Typically, we are supposed to buy at the bottom and sell at the top of the range. However, to save ourselves from the unexpected moves, we must wait for a couple of confirmation candles at the significant areas to trade accurately.
In the below chart, the market presenting us four buying and two selling opportunities in the AUD/NZD pair. We activated all the buy trades as soon as we see a couple of bullish candles near the support area.
We have also executed both the sell trades at the points mentioned in the price chart below. The entry was at the resistance level, where we have observed the formation of bullish confirmation candles.
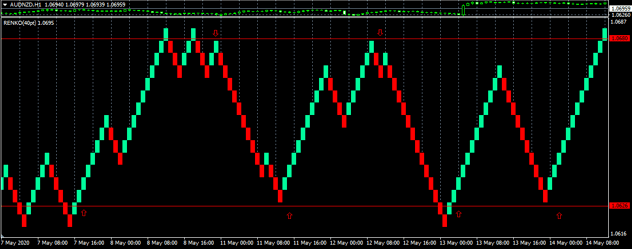
We stopped trading when the price broke the range crossing the resistance line. Place the stop-loss order just above the entry for sell trades and below the entry for buy trades.
Pros & Cons of Using Renko Charts
Pros
The most significant advantage of using Renko charts is that it removes the noise from the price chart. Renko helps novice traders in scanning the market quickly & efficiently.
While trading with candlestick charts, we would notice many wicks and tails. These fake moves could quickly shake the nerves of newbie traders.
However, on Renko charts, the price action behaves in an orderly manner. We will never witness any large or small bricks at any given point. This advantage of Renko charts makes them class apart from other technical charts.
Cons
While using Renko charts, one cannot see the complete data on the price chart. For instance, if a currency pair has been ranging for an extended period, it will be represented as a single brick on the Renko chart. Contrarily, on the candlestick chart, we get to explore the market’s DNA.
Renko charts are built to follow the price trend of an asset. We might often get false signals when the brick’s color changes too early, and it goes back to its original color to continue the ongoing trend. It is crucial to combine the Renko chart with other credible technical indicators for additional confirmation.
Renko charts ignore the high and low of the price and show the opening and closing prices alone. Hence a lot of valuable price information is lost since highs and lows of the price are widely used to make significant trading decisions.
Conclusion
Renko charts are for the traders who are willing to see a piece of clear cut information with fewer details. Both novice and experienced traders can take advantage of these charts to understand the market situation.
If you are an intraday trader, avoid using these charts as you will be missing a lot of price information. On the other hand, If you are an investor or swing trader who doesn't prefer to analyze the complex charts, Renko charts are an excellent option for you.


