We hope you enjoy reading this blog post.
Become a Pro Trader by using our fine-tuned Indicators and Expert Advisors.
Forex Trading Techniques: How to Utilize the MACD and RSI Indicators

The Forex market is known for its volatility and randomness.
An effective trading strategy is crucial for protecting and growing your trading capital over time. A cautiously designed strategy can support traders in identifying market trends, breakouts, and news facilitating more profitable trading opportunities.
One strategy our team came across leverages two well-known oscillators- the Relative strength index (RSI) and the Moving Average Convergence Divergence (MACD).
In this article, we will explore the fundamentals of MACD and RSI indicators, thoroughly understanding their calculations and applications, and the common strategies that combine MACD with RSI to assist traders in enhancing their market analysis techniques.
Understanding MACD and RSI indicators
RSI and MACD are among the most widely acknowledged indicators in trading. They are frequently combined to offer a distinct insight into the markets' behavior.
Exploring the variances, applications, and benefits of RSI and MACD can significantly boost your decision-making, strategy formulation, and overall trading performance—offering valuable advantages to any trader.
What is the MACD and How it is Calculated

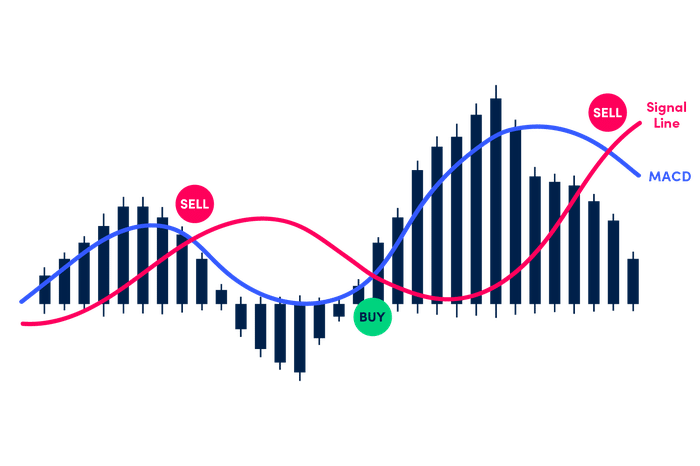
MACD is a popular momentum indicator that shows the relationship between two exponential moving averages (EMAs) concerning a security's price movements. The trend-following oscillator consists of three main components, a signal line, a histogram, and a MACD line.
When combined they provide valuable insight into the overall market trend, potential reversals, and momentum. It’s not just about price changes but about understanding the underlying strength or weakness in a market.
A 9-day EMA of the MACD called the “signal line,” is then placed above the MACD line, which functions as a trigger for buy and sell signals.
The MACD line is calculated by subtracting the 26-period Exponential Moving Average (EMA) from the 12-period EMA. (MACD= 26EMA –12EMA).
Mainly, the MACD line fluctuates above and below the zero level. The signal line is derived from a 9-period EMA of the MACD line, and it moves in tandem with the MACD line.
At times, the MACD line itself (or occasionally, the gap between the MACD line and the signal line) is represented visually as a histogram.
As we have suggested earlier the MACD is an oscillator, but it is not commonly used to identify overbought or oversold conditions.
How to trade the Moving Average Convergence Divergence (MACD)
There are several common strategies traders around the world use to trade using to integrate MACD within their trading strategies.
- Zero crossover: This strategy is mainly about using the zero line of the MACD. It involves buying when the MACD line crosses the zero line upwards, and they believe that it is a bearish signal when the zero line crosses down the MACD line.
This strategy is known to be delayed, so we don't recommend relying on the zero-crossover entry as it might be late. The zero crossovers can be used as a setup for trading using either buying or selling tactics. - Crossover between MACD and signal line: When the MACD line crosses the signal line, technical analysis traders suggest that it is a signal for a bullish crossover. Whereas, when the MACD line crosses down the signal line, suggesting a bearish crossover.
However since the MACD is a lagging indicator, traders might experience the pitfall of false breaks. - Histogram Divergence: This occurs when the price reaches a lower low, but the histogram forms a higher low, indicating a divergence on MACD histogram that the selling pressure is weakening and suggesting a potential upward reversal.
Conversely, when the price makes a higher high and the histogram shows a lower high, it signals that buying pressure is diminishing, suggesting a potential downward reversal.
It is also recommended to adjust the MACD settings based on your trading style, the specific instrument, and the chosen timeframe. You can also use multi-timeframe MACD for more comprehensive analysis.
What is the RSI and how it is calculated
The relative strength index (RSI) is a technical momentum oscillator like the MACD.

The relative strength index (RSI) is a technical momentum indicator that assesses recent price gains relative to losses, measuring the magnitude of price movements.
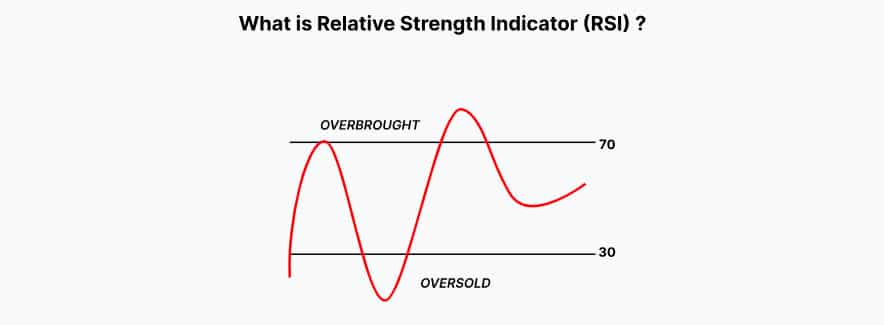
RSI values range from zero to 100, with readings above 70 typically signaling an overbought condition, and readings below 30 indicating oversold conditions—a key tool for traders.
However, assets deemed overbought or oversold may not immediately reverse since it is also considered a delayed indicator, underscoring the importance of confirming signals with other indicators before making buy or sell decisions, rather than relying solely on RSI signals.
The RSI is calculated by comparing the average of up closes to down closes over a specified period, producing an oscillator that fluctuates between 0 and 100. The formula for RSI is:
RS (Relative Strength)= Average gain/Average Loss
- Average Gain: Average of all upward price changes over a specified period.
- Average Loss: Average of all downward price changes over the same period.
Now that we have found the Relative Strength, we can deduce the Relative Strength Index (RSI) using this formula:
RSI= 100-(100/1+RS)
How to trade the Relative strength index
Here are the three most common methods to trade the (RSI).
Overbought/Oversold Signal
When the RSI exceeds 70, the market is considered overbought, and when it falls below 30, the market is considered oversold. These levels can be adjusted to better align with the specific market you are trading.
For instance, if the market frequently hits the overbought level of 70, you might adjust this threshold to 80. Keep in mind, however, that during strong trends the RSI can remain in overbought or oversold regions for prolonged periods.
Gauging the Trend
In an uptrend or bull market, the RSI typically stays within the 40 to 90 range, with the 40-50 zone acting as support. Conversely, during a downtrend or bear market, the RSI usually remains between 10 and 60, with the 50-60 zone serving as resistance.
These ranges can vary based on the RSI settings and the strength of the market trend.
RSI Patterns
The RSI can form patterns similar to the chart patterns to provide better trading signals. For instance, the oscillator might form double tops, bullish flags, etc..., mirroring similar pattern flags on the price chart.
A double top in the RSI occurs when the RSI peaks twice at a high level, indicating potential bearish divergence and a possible upcoming price decline. Recognizing these patterns can help you as traders anticipate price reversals and make more informed trading decisions.
MACD Vs RSI
RSI and MACD are momentum oscillators that traders and speculators use to track the current market conditions. However, each indicator is unique and has its characteristics, providing different information.
RSI Vs MACD – Purpose and Usage
RSI: The main purpose of the RSI is to spot overbought or oversold market conditions. It assists traders in forecasting if the current price trend is about to experience a reversal, correction, or continuation.
The best performance of the RSI appears to be in range-bound markets, where the price of the underlying asset fluctuates between support and resistance areas.
MACD: Alternatively, the MACD indicator comes into play when you want to identify the direction, strength, duration, and momentum of a trend.
It is most effective in trending markets, where the trader aims to decide whether to stay with the trend or, if the MACD shows signs of the trend weakening, to exit before the price starts to reverse.
RSI Vs MACD – Components and Calculation
RSI: Calculated by using the average gains and losses over a certain period, by default 14 Days. Which results in a single value that varies and oscillates between 0 and 100
MACD: Whereas, MACD is calculated using two exponential moving averages (EMAs) and the spread between them. This data is used to design the indicator's histogram, MACD line, and signal line.
RSI Vs MACD – Potential Drawbacks
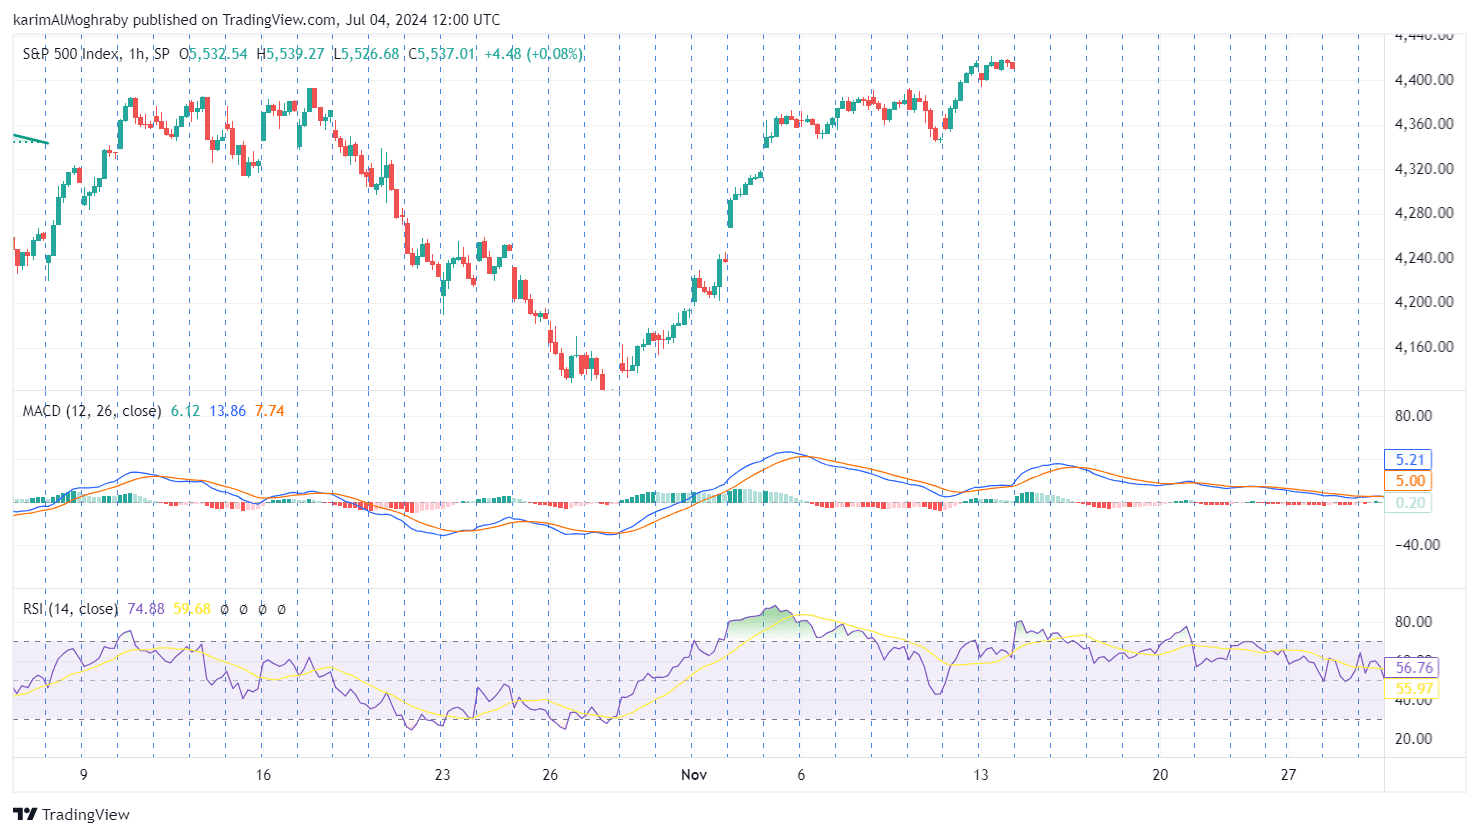
RSI: One of the main disadvantages of the Relative Strength Index is its susceptibility to producing false signals during strong trending markets. For example, in a robust uptrend, the RSI may stay in the overbought range (above 70) for a prolonged period.
This prolonged overbought condition can mislead traders into thinking that a reversal is imminent, prompting them to exit their positions too early or refrain from entering new long positions, only to see the price continue rising.
The key challenge with RSI in such scenarios is its inability to effectively differentiate between a genuine reversal and a sustained trend, making it less reliable without additional confirmation from other indicators.
MACD: The Moving Average Convergence Divergence (MACD) indicator also has its drawbacks. One significant limitation is its tendency to lag behind real-time price movements due to its reliance on historical data. The MACD is calculated using moving averages, which are inherently backward-looking.
As a result, the signals generated by the MACD—such as the crossing of the MACD line over the signal line—often occur after the price movement has already begun. This time lag can lead to late entry or exit signals, potentially causing traders to miss the best points for initiating or closing trades.
This delay can be particularly problematic in fast-moving markets, as price movements can be swift and significant.
MACD and RSI strategy

In this article, we have already covered both indicators. Now, we will discuss what MACD and RSI strategy that combines the best of the two worlds.
And yes, MACD with an RSI strategy can make up trading strategies.
Some technical analysts argue that using two momentum indicators together might be redundant. They question the need for two indicators when one can provide the same information.
When the RSI rises from the overbought region, the MACD line will often cross the signal line, indicating similar market conditions. Why clutter the chart with multiple indicators if they convey the same message?
Even those who favor using numerous indicators would agree that a cleaner chart helps avoid analysis paralysis.
While the argument above holds merit, many traders opt to use the RSI MACD strategy to leverage the strengths of both indicators. Depending on the trader's approach and application, the combination of MACD and RSI indicators can prove advantageous. Here’s why:
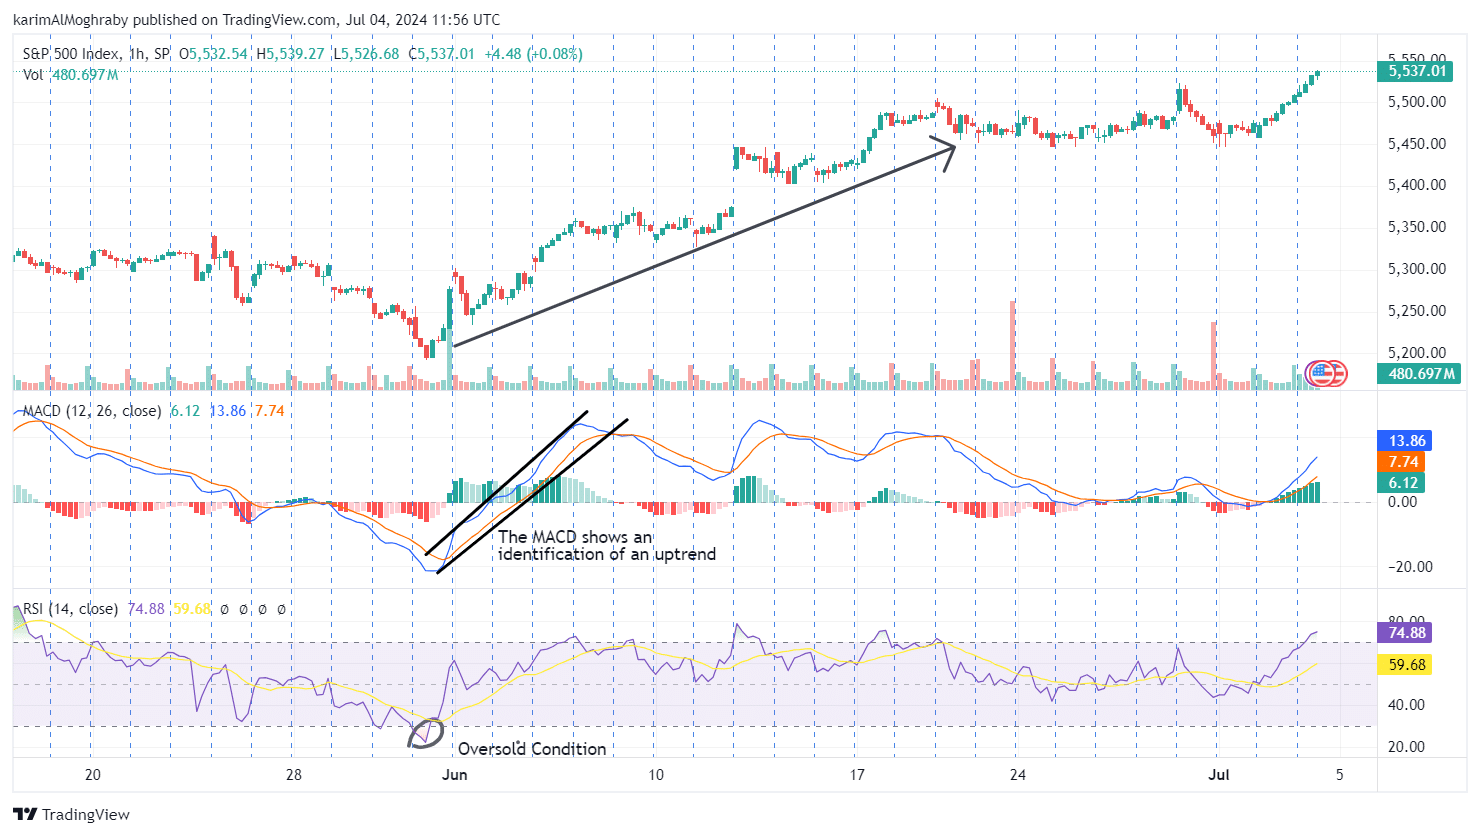
- Signal confirmation: The RSI is a leading indicator, and one thing about leading indicators is premature signals. Here comes the role of MACD (lagging indicator) to meet at half and confirm the signal from the RSI.
As we discussed earlier, the RSI may be oscillating in a certain region for a long time (Overbought or Oversold). In such cases, the MACD helps to know when the momentum is starting to slow down, helping you better time the reversal. - Filtering the noise: With the combined use of MACD and RSI, you receive multiple confirmations, which significantly reduce the chances of false signals. This heightened reliability can instill greater confidence in your trading strategy, allowing you to make decisions more confidently based on reinforced signals.
- Spotting Divergences: RSI and MACD are effective in identifying divergences. When both indicators show divergence from the price action, it strongly indicates a potential trend reversal.
- You can create more strategies from the combination: There are numerous ways to combine these indicators to generate trading signals. This includes adjusting their parameters to better suit the specific market conditions you are trading in. By exploring different settings and methods of combination.

Conclusion
RSI and MACD are indispensable tools for technical traders. The RSI excels in identifying overbought or oversold conditions in range-bound markets, while the MACD shines in trending markets by pinpointing shifts in momentum and trends.
By understanding the unique characteristics of these indicators and integrating them effectively, traders can deepen their insights into market dynamics and improve their decision-making.
Successful trading demands a flexible approach, incorporating a variety of indicators and adapting strategies based on market conditions and performance analysis. Keep learning and refining your skills to stay ahead in trading endeavors!
Take Your Trading to Next Level
Take Your Trading to Next Level
You Might Also Like:


